Principles · Laniakea Partners
Modern Value Investing
Our contribution to the corpus of value investing philosophy — the framework reconstructed from first principles, the historical conditions that have expired, and what a practitioner holding Graham's actual commitments should be doing today.
Foreword
The following represents Laniakea Partners' contribution to the corpus of value investing philosophy that has been added to by countless investors over the decades. We present here our understanding of the practice, as well as its history and future as a discipline. We hope that it serves as a helpful guide for admirers and learners of the value investing framework. However, we caution against the view that fully digesting these materials will generate meaningful above-market alpha for the average investor; rather, we believe that understanding the contents of this essay has become 'table stakes' in successful long-term fundamental investing, and that successful investing requires the development of additional specialised mental models and a variant perception, which this essay only briefly covers.
Part One — Foundations: what value investing is, and how the term was perverted
Value investing treats a common stock as a fractional claim on a business's future cashflows. The purchase price is judged against a probability-weighted estimate of those cashflows, and not against what other market participants are expected to think. Graham assembled the framework in the 1930s, when the market priced equities as instruments of speculation, and Buffett converted it into a four-decade operating record. The decades since have attached a stylistic distortion to the term which this document exists partly to strip away, namely the reduction of a philosophy of valuation to a screen for low multiples on slow-growing businesses. That reduction is neither what Graham taught nor what compounded capital in practice.
The distortion routed a generation of disciplined practitioners into the cheapest fifth of the market by price-to-book, it taught allocators to hire managers for their factor exposure instead of their judgement, and it left the philosophy blamed for the returns of a cohort that merely wore its name. This Part thus reconstructs the framework from first principles, traces the historical conditions that let it work, and identifies which of those conditions have expired. It then asks what a practitioner holding Graham's actual commitments should be doing in a market where the participant base is numerate and businesses change faster than any of Graham's securities ever did.
1.1 Origins and closing of the historical window of simple cigar-butt value investing
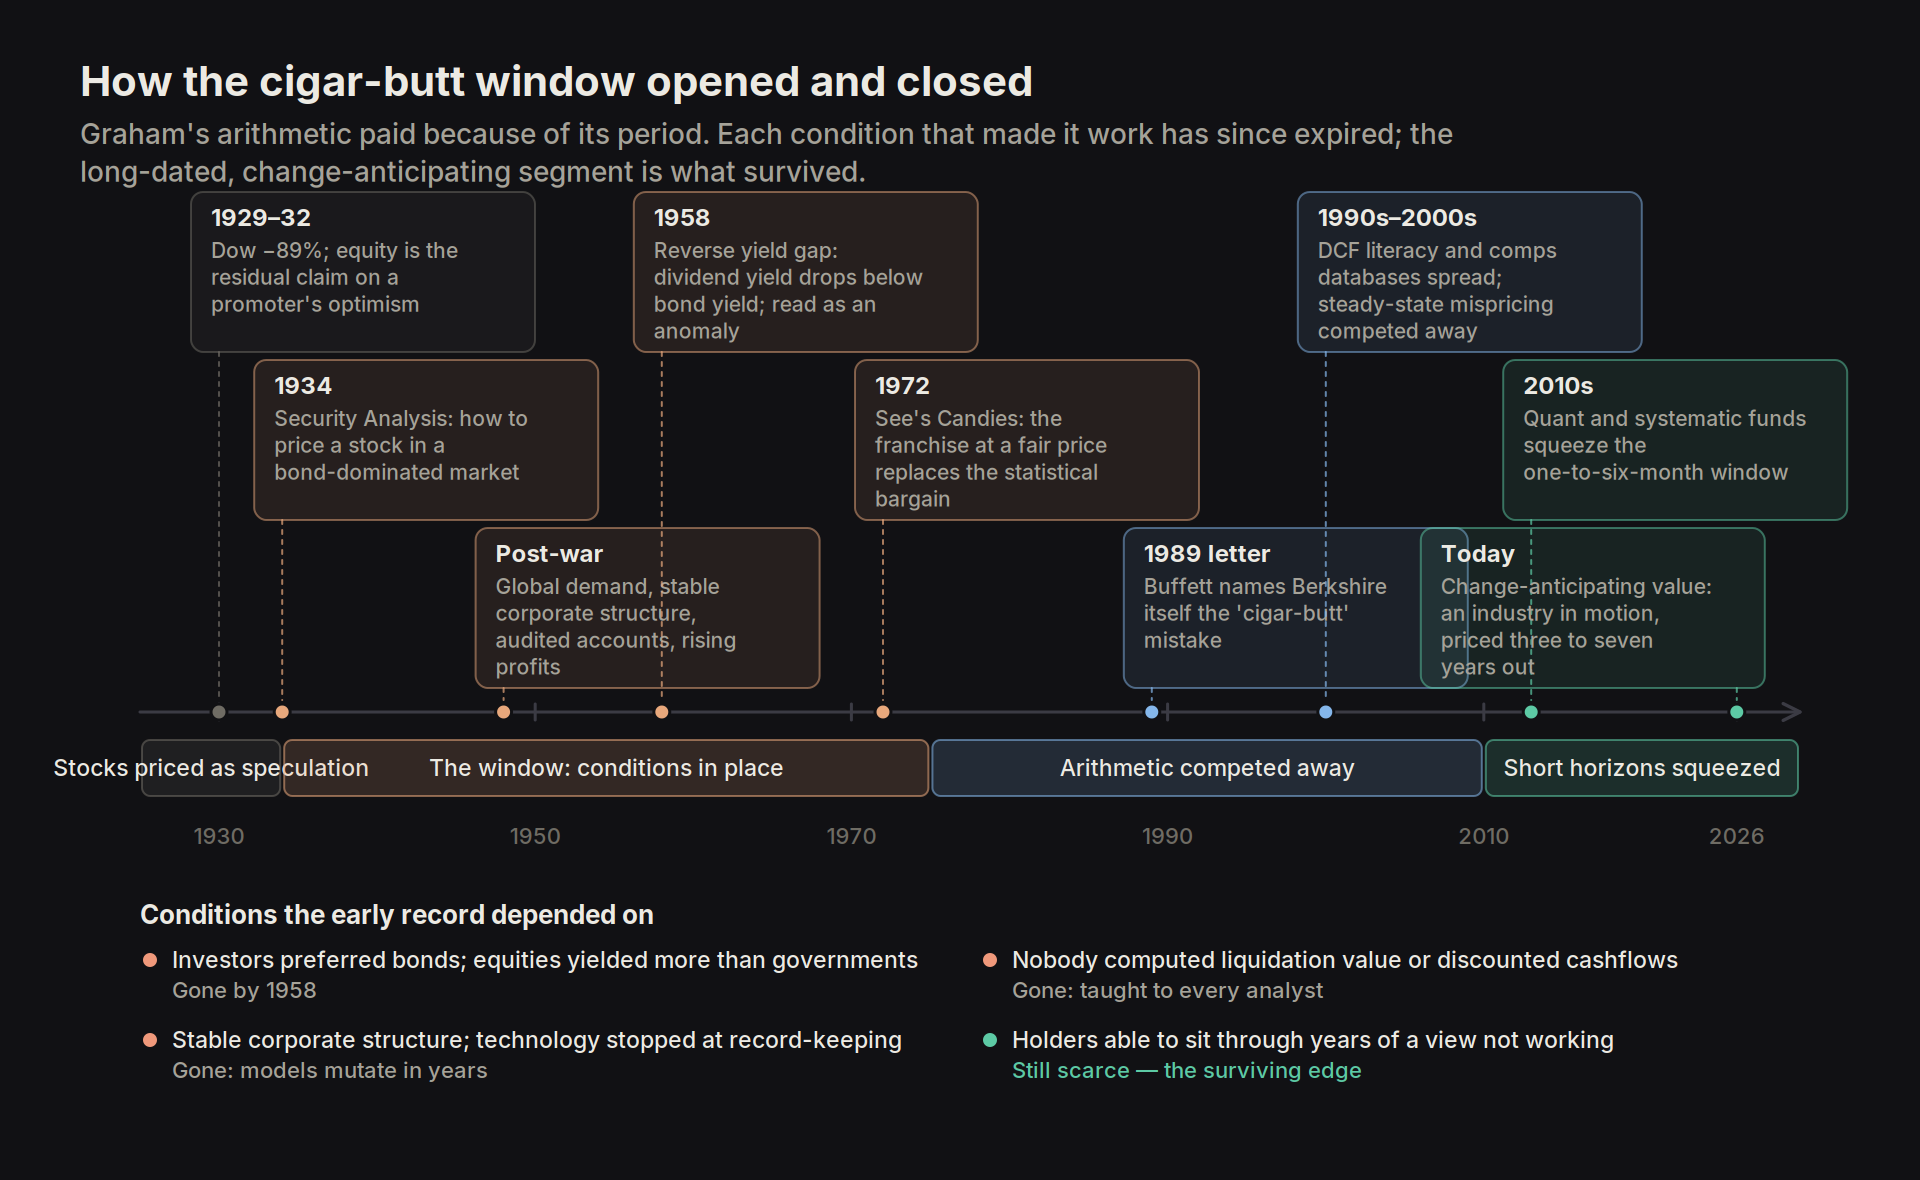
For a century before Graham, common stocks had a well-earned reputation as instruments of speculation. American equity price history up to 1934 was a record of railway promotions, utility holding-company pyramids and industrial trusts floated on 'watered' stock (shares issued against assets that did not exist), punctuated by repeated booms and busts. The Great Depression, in which the Dow lost 89 per cent of its value between September 1929 and July 1932 and dividend suspensions ran across the list, settled the argument. Debt also made up a far greater portion of the capital stack with equity as a lump. An investor coming out of the 1930s thus held the base rate that equities were inherently risky and made poor investments, and as a description of the historical record this was accurate. Bonds ranked first in the risk hierarchy and the equity holder last, as the residual claimant on a promoter's optimism.
Four things drove the divergence from the historical record: the globalisation of American industrial demand, the post-war settlement, the professionalisation of corporate accounting under the new securities acts, and four decades of stable corporate structure with steadily rising profits. Between them they converted the equity claim from a lottery ticket on a promoter's balance sheet into a compounding claim on the most durable earnings stream in economic history.
Graham's framework in Security Analysis (1934) was thus a solution to a pricing problem: how to price a common stock in a bond-dominated market that had no agreed method for doing so. Buffett's adoption and popularisation turned an academic method into an industry identity, and in doing so obscured how much of the early record was owed to conditions rather than technique. The framework worked because of its period. Post-Depression corporate structure was unusually stable, technology barely penetrated the operating model of the average listed company beyond record-keeping (the IBM era), profits rose steadily for decades, and investor appetite for equities stayed depressed relative to the growth actually delivered. Durable businesses therefore traded at yields that treated them as fragile, bond-like claims when they were in fact compounding at equity-like rates.
The early alpha for the value investing framework came from the demand side. Post-war investors preferred bonds even though equities were cheaper once growth was taken into account, the dividend yield on equities exceeded the yield on government bonds until the late 1950s, because a market that expected equities to fail demanded to be paid more to hold them, and when the two crossed in 1958 in what became known as the 'reverse yield gap' the consensus read the crossover as a temporary anomaly rather than as the repricing of the equity claim that it was. The growth then lasted far longer than almost anyone underwrote. The value investors of that period were not primarily better analysts than their peers; they were the minority disciplined enough to price stocks against an estimate of fair value at all, while the rest of the market was speculating on the supply and demand for the security itself. An entire generation's edge thus came from applying arithmetic in a room where almost nobody else was applying it.
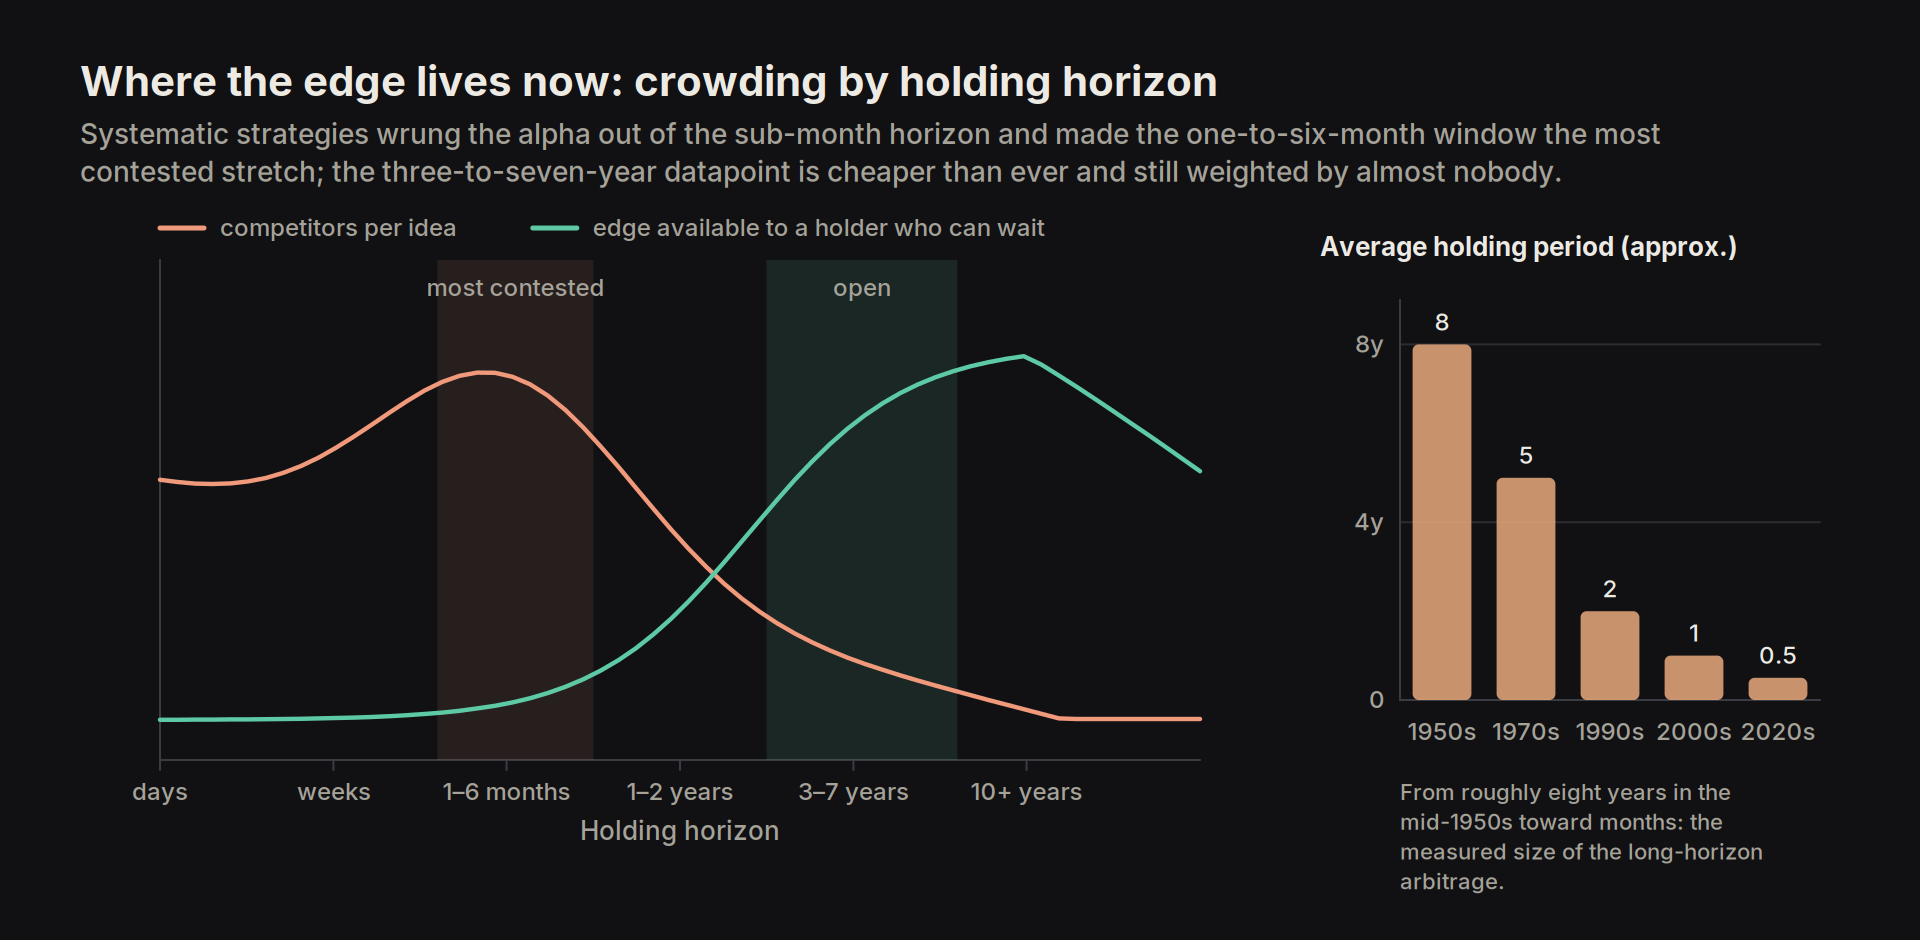
The window closed in stages, and Buffett dated the first stage himself: his 1989 letter records the purchase of Berkshire Hathaway, a failing textile mill bought for its discount to working capital, as the 'cigar-butt' mistake that taught him that a fair business at a wonderful price loses to a wonderful business at a fair price, and the shift from Graham's statistical bargains to franchise ownership was the discipline's first adaptation to a market that had learnt to compute liquidation value. Once discounted-cashflow (DCF) literacy, comparables databases and mass corporate-finance education spread, the steady-state mispricing of durable businesses was competed away and the simple act of discounting cashflows stopped paying. Quantitative and systematic strategies then squeezed the returns out of the very short and the short-to-medium horizons, to the point where the one-to-six-month window is now the most competitively contested stretch of the curve. The segment that survived is the long-dated, qualitative, change-anticipating one, the part of the problem that cannot be reduced to a formula applied to reported numbers because it requires a model of an industry in motion. In latter parts of this essay, we argue that further adaptation to the contemporary environment is required to practice value investing today.
1.2 The investment versus speculation distinction
Graham's definition, from Security Analysis, is quoted in full: "An investment operation is one which, upon thorough analysis, promises safety of principal and an adequate return; operations not meeting these requirements are speculative". Three conditions, all of them necessary: thorough analysis, safety of principal and an adequate return. Everything outside the definition is speculation.
Investing and speculation are two different pricing disciplines:
- Investing compares the entry price with a probability-adjusted profile of the future cashflows the business will produce if held to maturity, discounted at some rate above the risk-free rate.
- Speculation compares the entry price with the future supply and demand for the security itself, and profits from a correct reading of where sentiment will be rather than where cash will be.
Both can generate positive returns when executed well, and every securities purchase is in practice a mixture of the two, since even a pure cashflow thesis depends on someone eventually agreeing enough to buy the position.
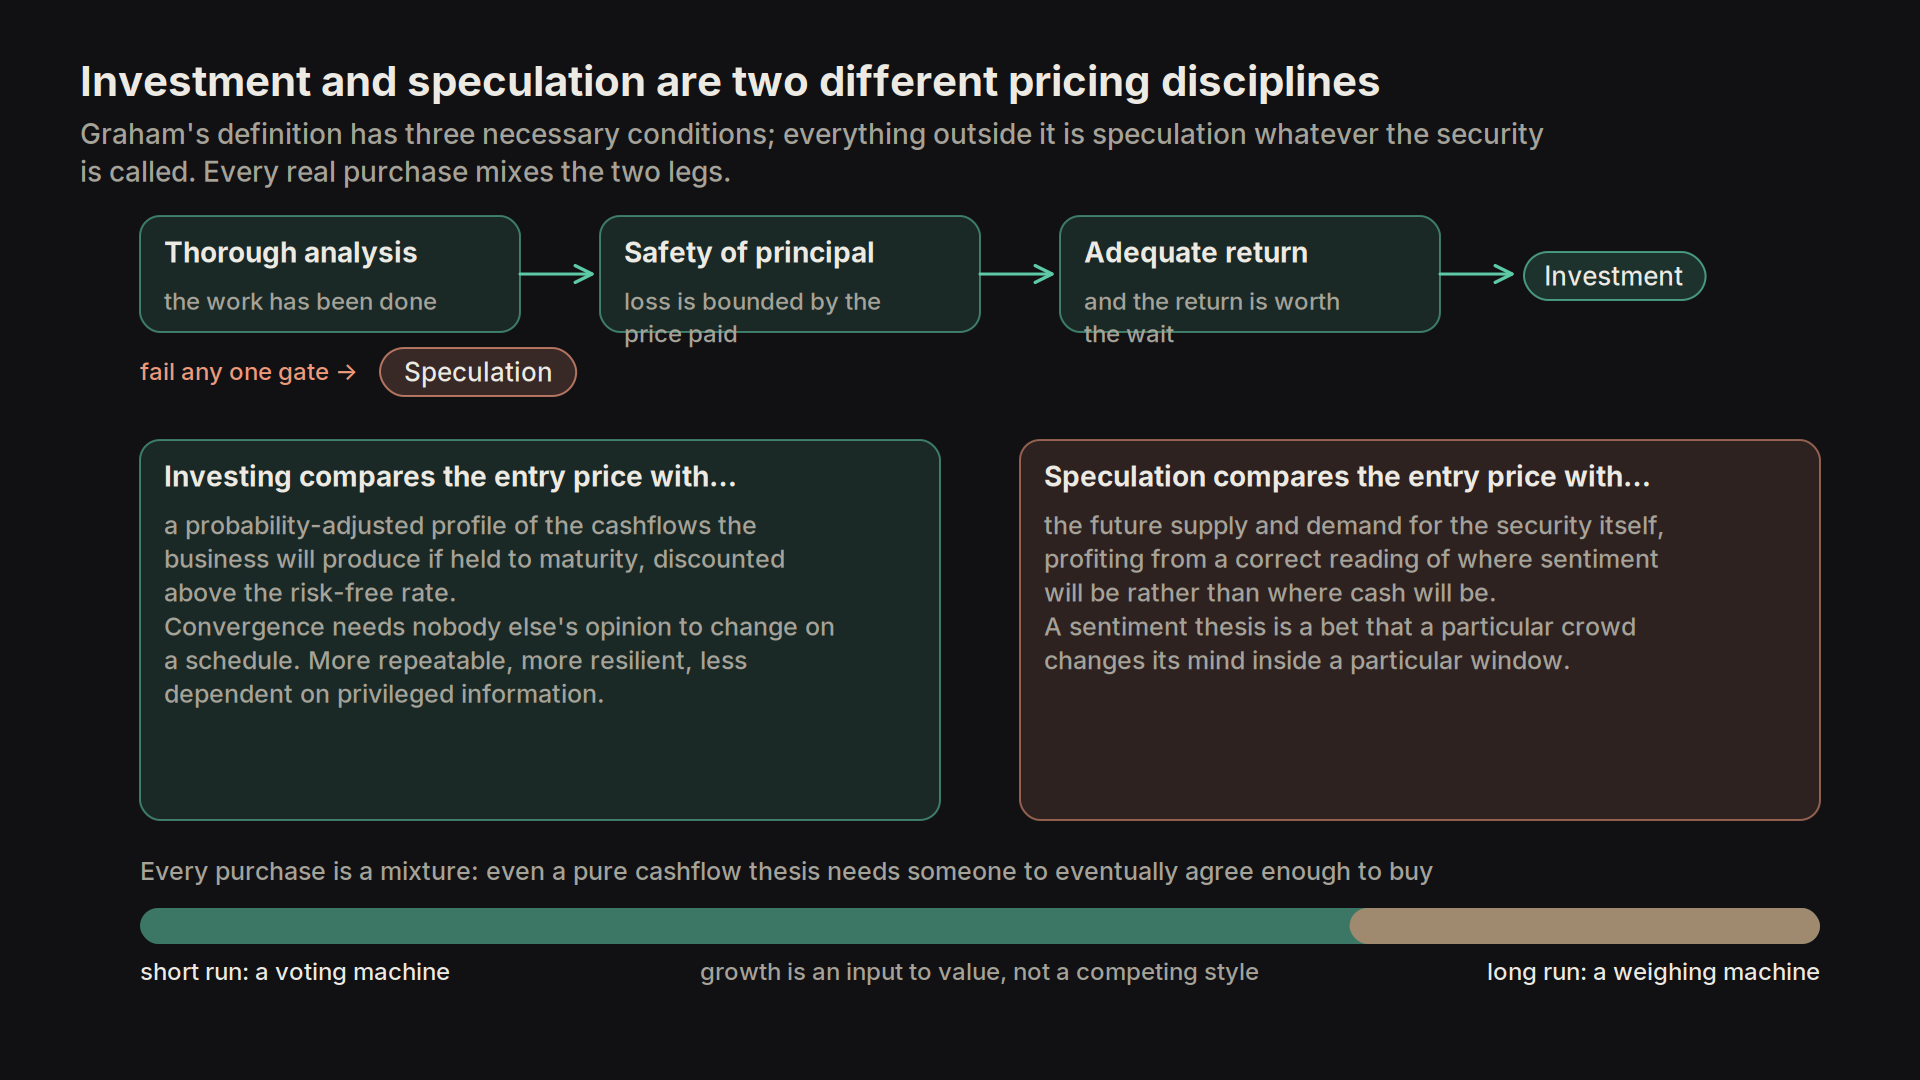
The value school does not claim the speculative leg is illegitimate. It claims the investing leg is more repeatable, more resilient to risk and less dependent on privileged information. Cashflow convergence does not require anyone else's opinion to change on a schedule, whereas a sentiment thesis is effectively a bet that a particular crowd changes its mind inside a particular window.
Buffett's 1992 letter settles the vocabulary: "the very term 'value investing' is redundant", since all intelligent investing seeks value at least sufficient to justify the amount paid, growth and value are "joined at the hip", and growth is an input to the value calculation rather than a competing style, a large positive input when the returns on the capital reinvested exceed the cost of that capital and a destructive one when they do not. Munger put the same point without the qualification: all intelligent investing is value investing, acquiring more than you are paying for. Ownership is the stance that follows, since Graham's businesslike rule, that investment is most intelligent when it is most businesslike, goes together with his voting-and-weighing image, in the short run a voting machine and in the long run a weighing machine, so the stockholder behaves as an owner and treats erratic quotations as an opportunity set, because, in Graham's words from The Intelligent Investor, "you are neither right nor wrong because the crowd disagrees with you; you are right because your data and reasoning are right".
1.3 How the term was perverted
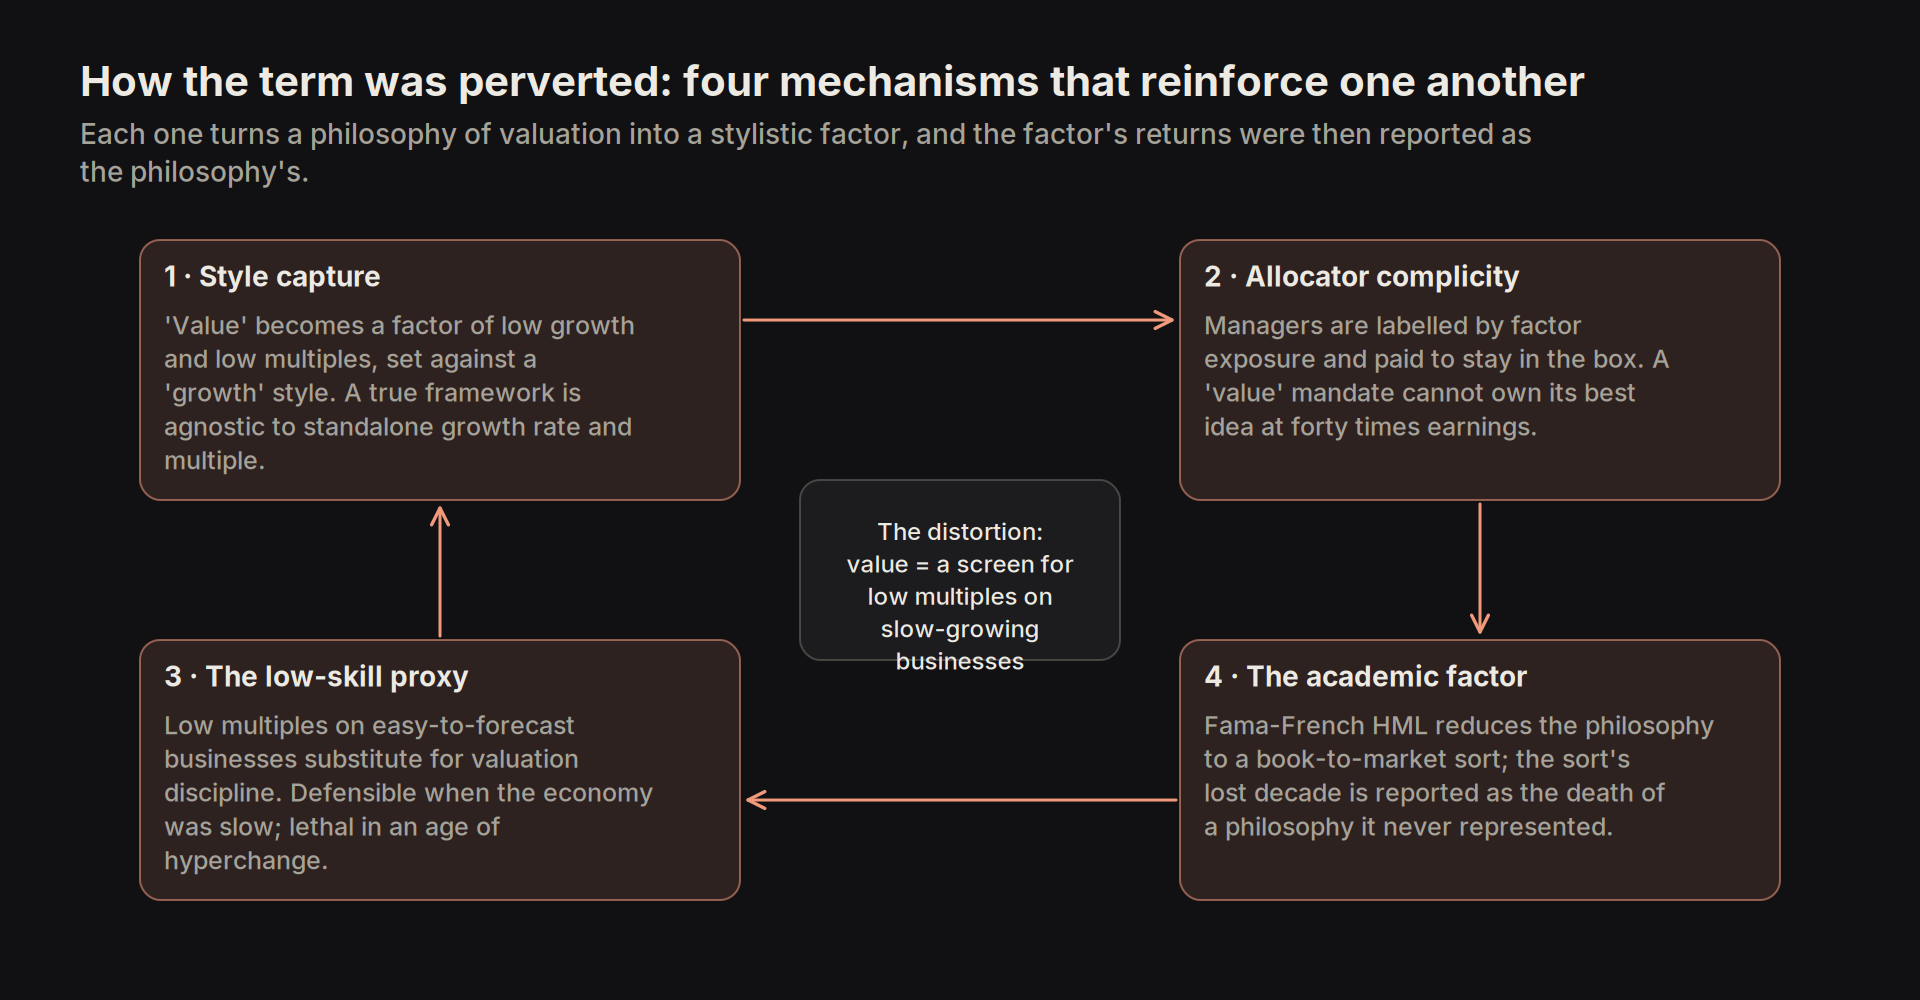
Today the term value investing is a confusing one, associated with boring, low-growth and optically 'cheap' businesses and with a cohort of practitioners who have generated below-market returns for an extended period. Four mechanisms produced the confusion, and they reinforce one another.
The first was style capture. The label 'value' became attached to a stylistic factor of low growth and low multiples, set against a 'growth' style preferring the opposite. This does the philosophy a major disservice, because a true value framework is agnostic to an opportunity's standalone growth rate and multiple. An appropriate book contains both 'styles' at once and rotates between them, over- or under-weighting each as market conditions change the relative prices of duration and stability.
The second was allocator complicity. Allocators label managers by factor exposure and allocate accordingly, which pays practitioners to stay inside their box and turns a descriptive heuristic into a binding mandate. A manager whose mandate says 'value' and whose best idea trades at forty times earnings is structurally unable to own it, regardless of what the cashflows justify. The insistence on labelling first and assessing skill second is a structural contributor to the confusion, and it is the same institutional pathology in which the industry's intermediaries reward what is easy to label over what is hard to judge.
The third was the low-skill proxy. Weak practitioners with low forecasting confidence used low multiples on stable, easy-to-forecast businesses as a substitute for valuation discipline and margin of safety. This is a somewhat defensible heuristic in a slow-changing economy and a lethal one in a fast-changing economy. In an age of hyperchange those businesses are appropriately priced, and often generously priced, against their actual future cashflows, so the cohort's poor returns were deserved and the philosophy was blamed for the cohort.
The fourth was the hollowing of the philosophy into an academic factor. Low price-to-book, low price-to-earnings and high dividend yield are "far from determinative" of a value purchase, and a high price-to-book alongside a high price-to-earnings ratio is "in no way inconsistent" with one, from the same 1992 letter. The Fama-French HML/value factor (a portfolio that is long the cheapest stocks by book-to-market and short the most expensive) reduced a philosophy of valuation to a book-to-market sort, and the factor's subsequent decades of underperformance were then reported as the death of a philosophy that the sort never represented.
The confusion dissolves once 'value' is read as a family of operations rather than as a style, each with its own source of return and its own set of conditions, most of which have expired:
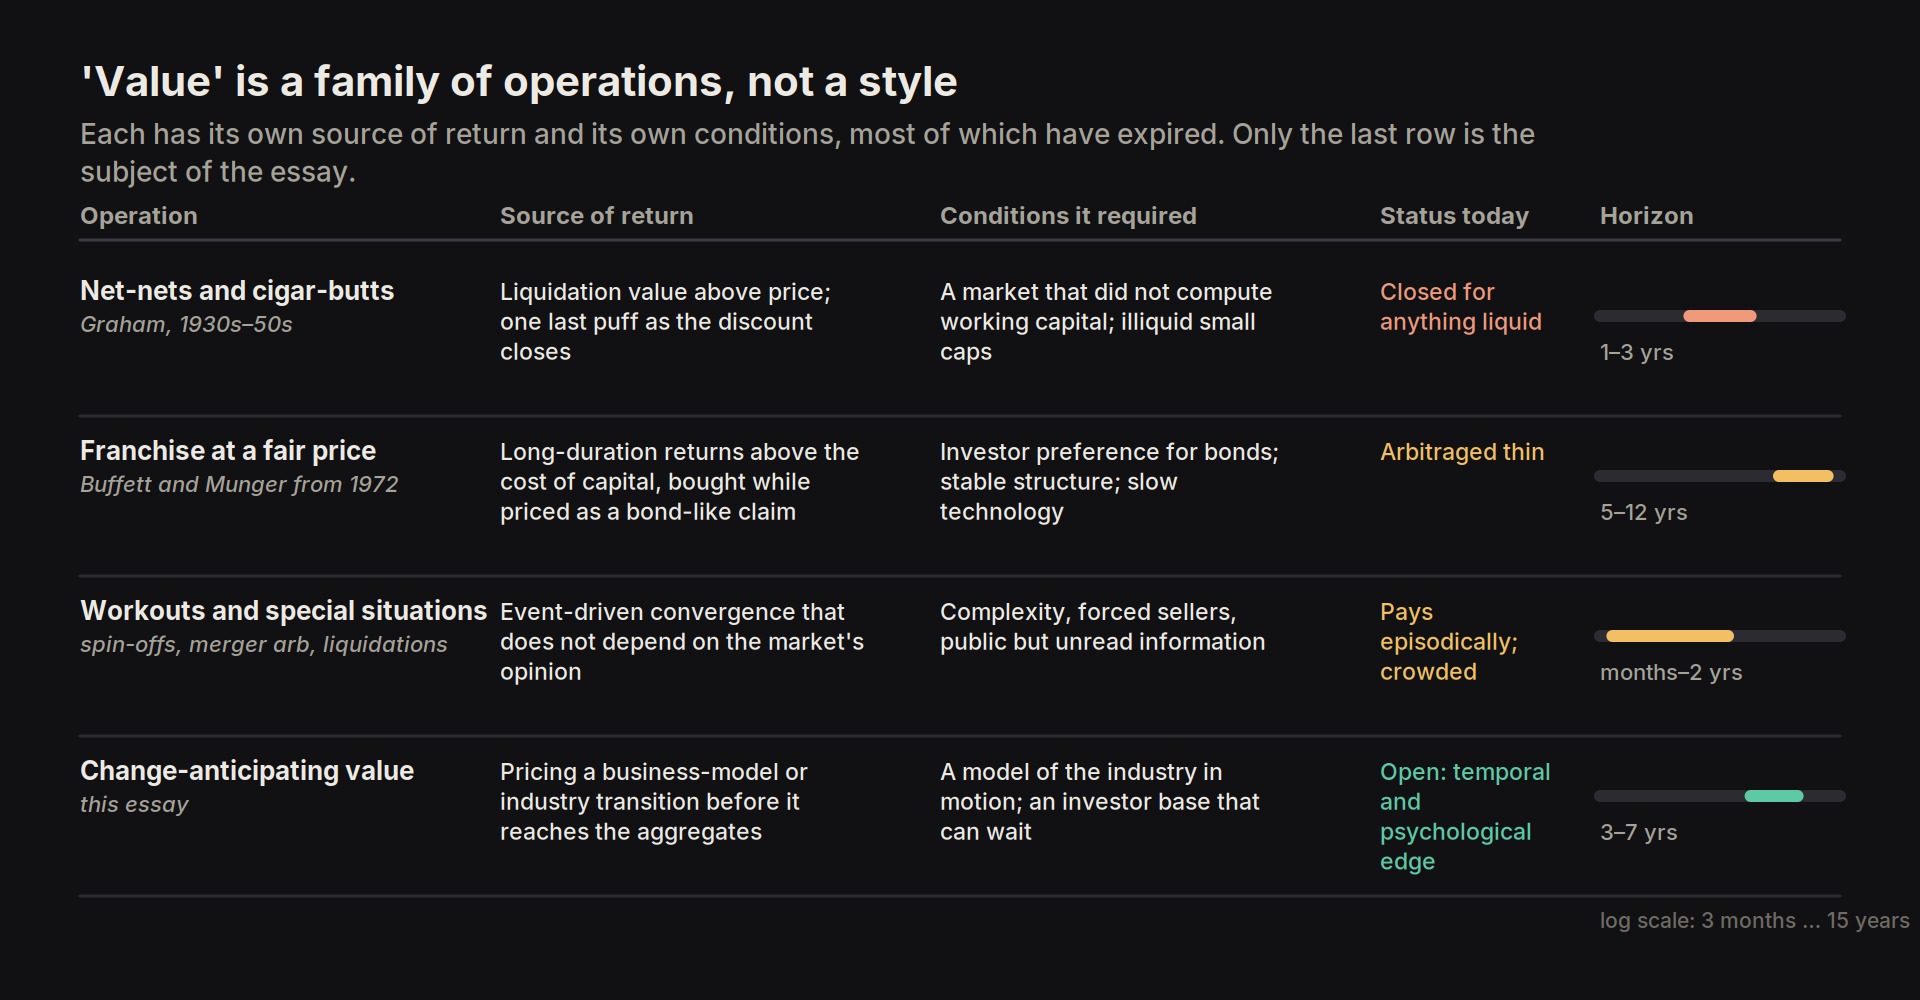
Only the last row is the subject of this essay, and the table is the reason the label 'value' attached to the first two rows says nothing about the fourth.
1.4 The core tenets of value investing restated
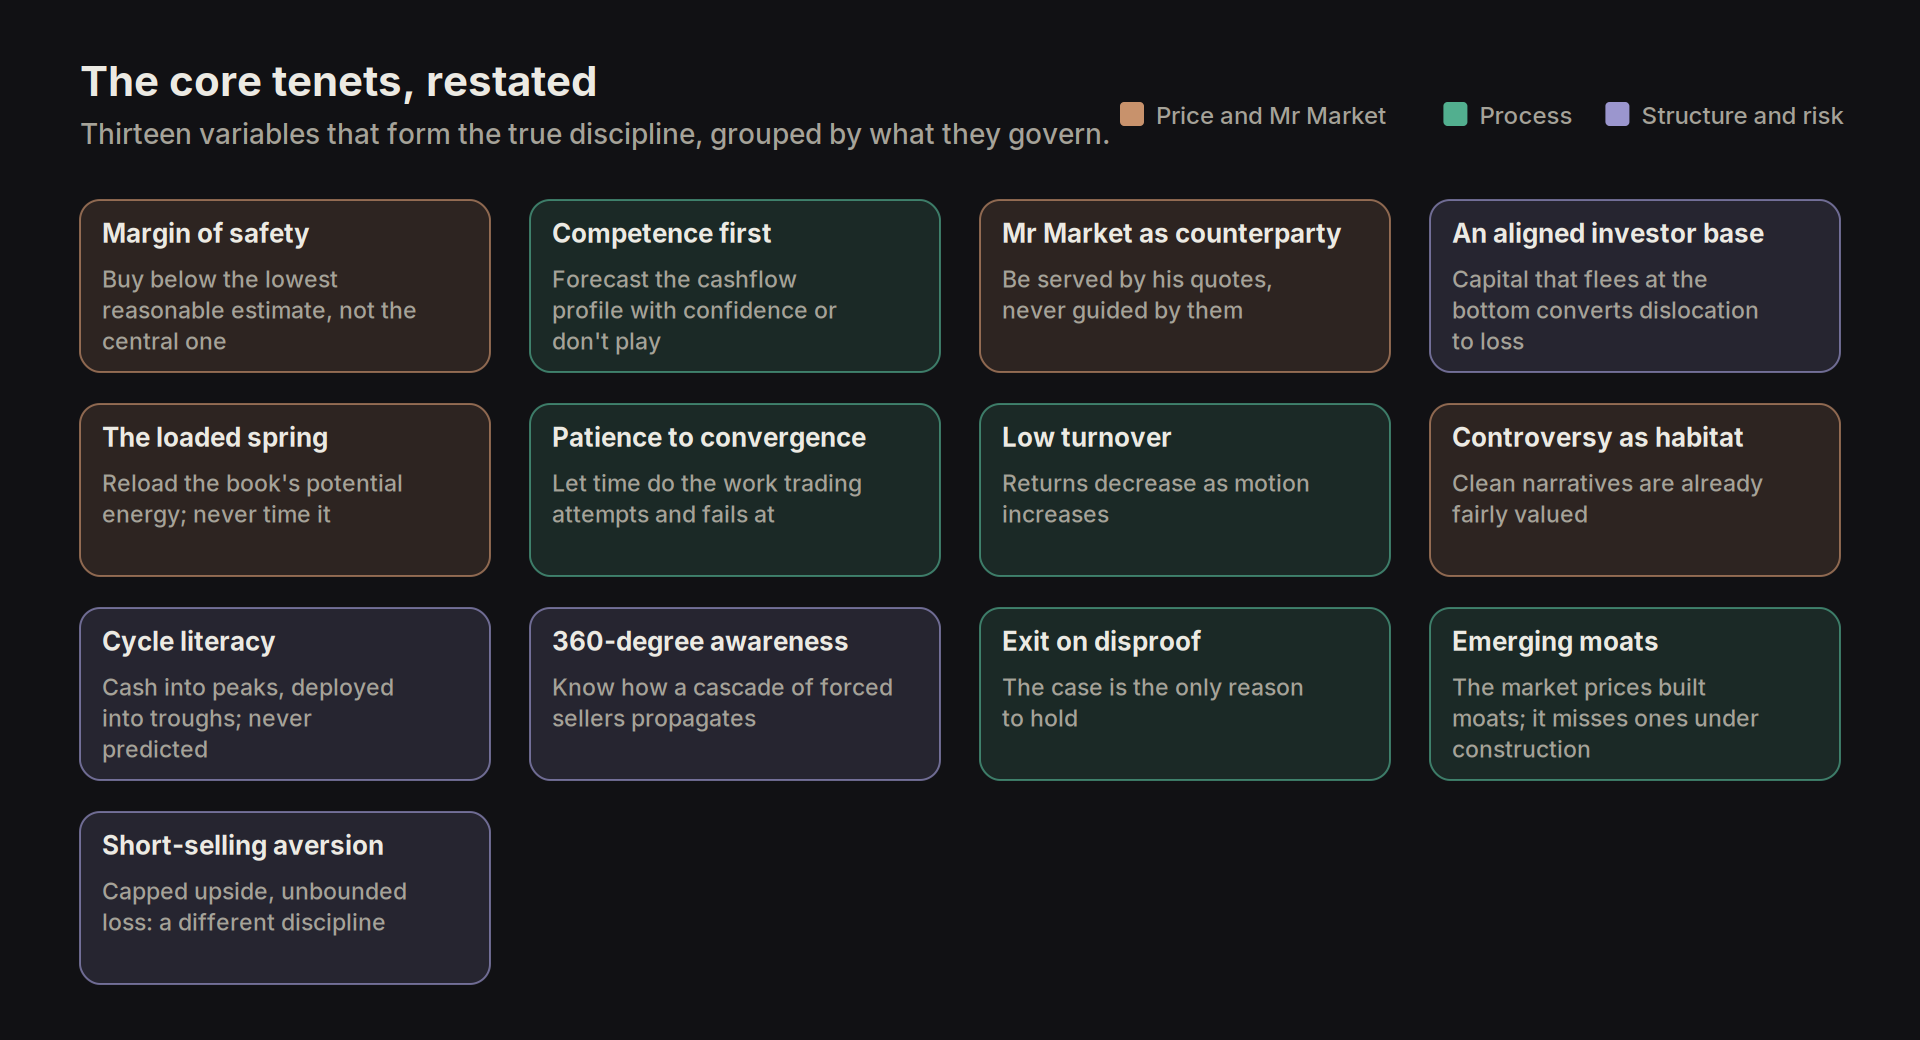
To avoid confusion and restore a degree of sanctity to the term 'value investing', we restate the variables that form the core of the true discipline:
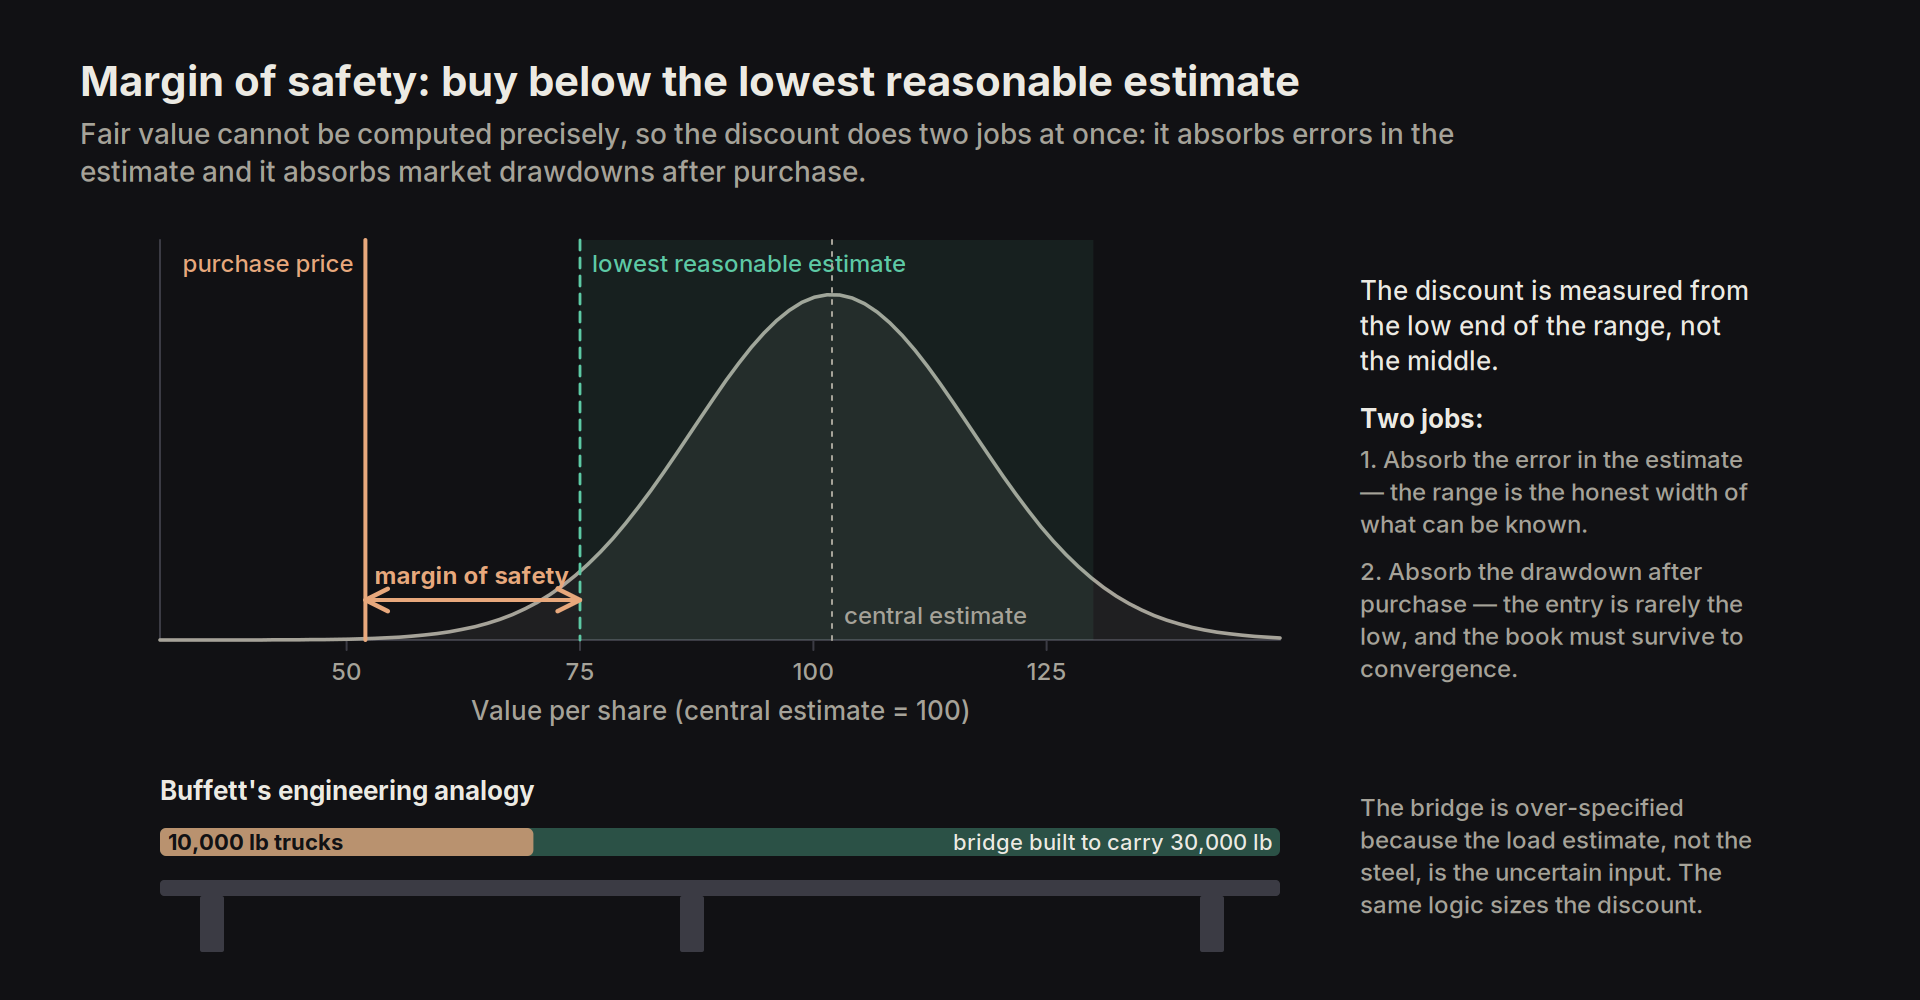
- Margin of safety. Buy meaningfully below the lowest reasonable estimate of value, not below the central one. Fair value cannot be computed precisely, so the discount does two jobs at once: it absorbs errors in the estimate and it absorbs market drawdowns after purchase. Buffett's engineering analogy is the clearest instruction, that one builds the bridge to carry thirty thousand pounds and then drives ten-thousand-pound trucks across it.
- Competence before conviction. Understand each opportunity well enough to forecast a probability-adjusted cashflow profile with confidence. An intrinsic value estimate produced without that understanding is decoration applied to a guess, and the decoration is worse than the guess because it turns an acknowledged uncertainty into an unacknowledged one.
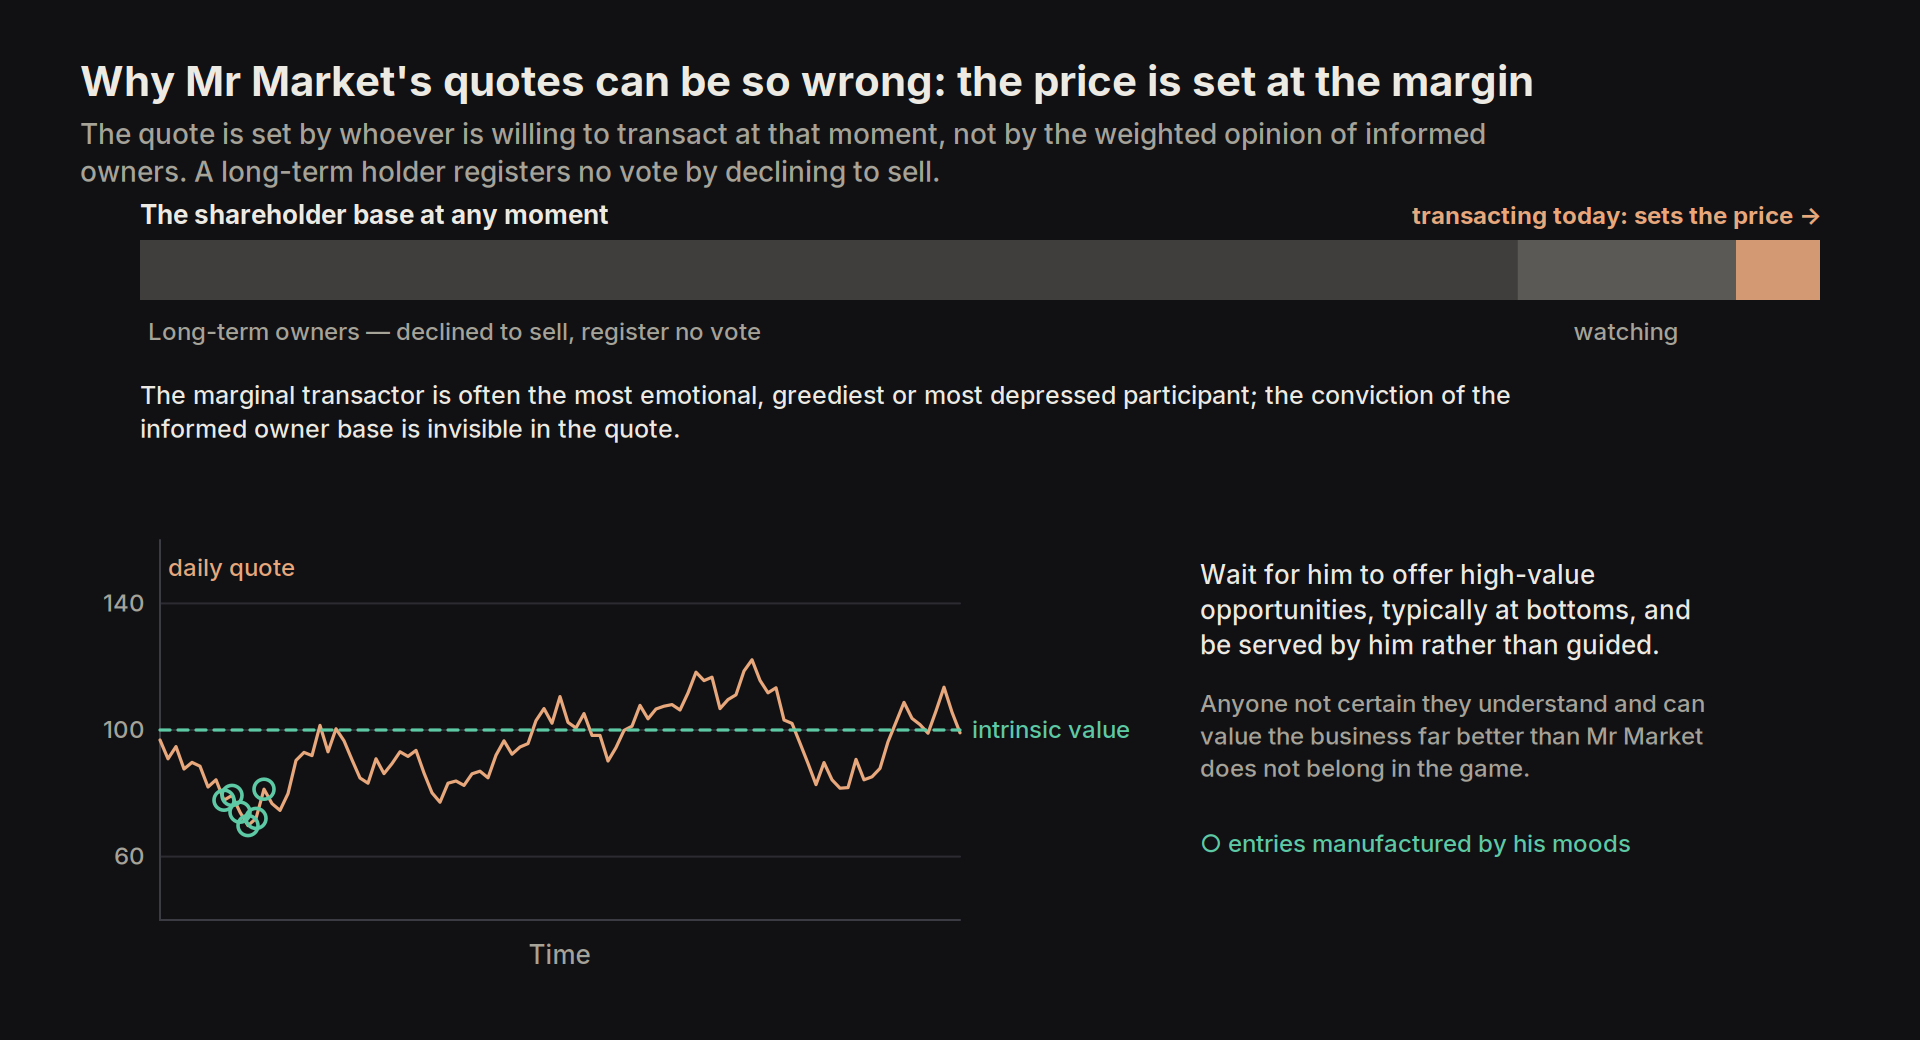
- 'Mr Market' as counterparty. Graham's manic-depressive business partner quotes prices every day and is under no obligation to be sensible. The discipline is to wait for him to offer high-value opportunities, typically at market bottoms, and to be served by him rather than guided by him. Buffett's restatement is that anyone not certain they understand and can value the business far better than Mr Market does not belong in the game. His quotes can be so wrong because prices are set at the margin by whoever is willing to transact at that moment, often the most emotional, greediest or most depressed participant, and not by the weighted opinion of informed owners. A long-term holder registers no vote at all, having simply declined to sell, so the conviction of the informed owner base is invisible in the price.
- An aligned investor base. A book that compounds through troughs needs investors who are indifferent to drawdowns. Capital that flees at the bottom converts a temporary dislocation into a permanent loss, and does so at exactly the moment the opportunity set is richest
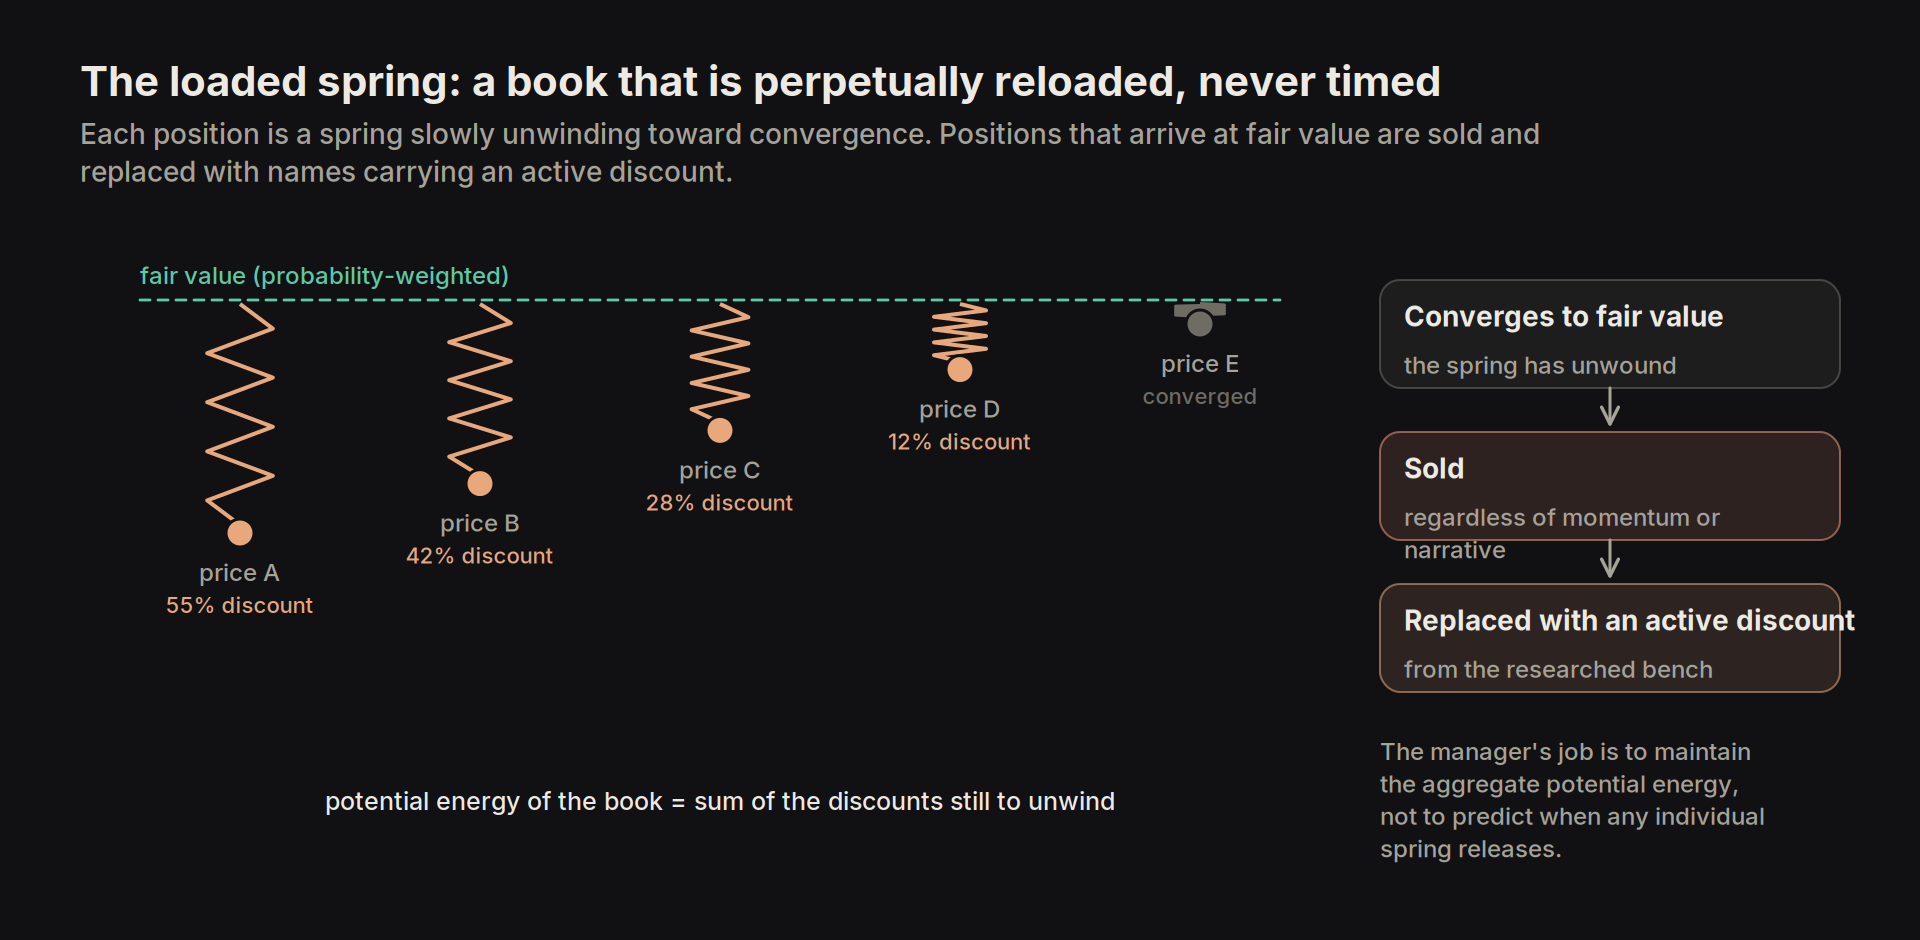
- The 'loaded spring'. The portfolio is a set of positions whose fair value differs from their price, each a loaded spring slowly unwinding toward convergence. Positions that arrive at fair value are sold and replaced with names that carry an active discount, so the book is perpetually reloaded and never timed, and the manager's job is to maintain the aggregate potential energy rather than to predict when any individual spring releases.
- Patience to convergence. Hold until the business's cashflows converge on the estimate, letting time do the work that trading attempts and generally fails at. "Our favorite holding period is forever" (1988 letter) applies to portions of outstanding businesses assessed carefully over long periods of research, and inactivity in the absence of a better idea is seen as the intelligent posture.
- Low turnover. Time goes to understanding new businesses and assessing their value instead of trading themes, since "for investors as a whole, returns decrease as motion increases" (2005 letter) and the market is "a relocation center at which money is moved from the active to the patient" (1991 letter). A research calendar dominated by existing positions is a symptom of an under-supplied pipeline.
- Controversy as habitat. The best purchases are unpopular, controversial or actively hated, because a stock with positive momentum and a clean narrative is generally fairly valued already. Hunting for underappreciated opportunities, and holding them through the further drawdowns that typically follow the initial purchase, should thus dominate the research process.
- Cycle literacy. Assess where the market cycle stands, accumulate cash while nearing peaks, and deploy it into troughs. The objective is never to predict the cycle's timing but to refuse to be governed by it. The cost of holding cash through an extended melt-up is an opportunity cost, while the cost of being fully invested into a trough with no dry powder is the loss of the decade's best entries.
- 360-degree awareness. A permanently agile mentality toward risks both stock-specific and systemic, with particular attention to the mechanics of panics, since investment entry points are manufactured by them. An investor who does not understand how a cascade of forced sellers propagates cannot tell the fourth day of one from the last.
- Exit on disproof. The original case is the only reason to hold. Once it is disproven the position is sold immediately, without reference to the loss taken, the tax year or the hope of recovery.
- Moats, especially emerging ones. Identify the economic moats that explain why high growth and high returns on capital can persist for long periods, with particular attention to moats that are still forming, since the market generally prices established moats efficiently and routinely misses the ones under construction. Management's job, in Buffett's castle metaphor, is to keep widening the moat, which makes capital allocation and moat quality effectively the same variable observed at different frequencies.
- Short-selling aversion. A short position caps the upside at one hundred per cent while leaving the loss unbounded, the mirror image of a long position, so shorting is treated as a different discipline with different holding rules.
Part Two — The temperament of the value investor
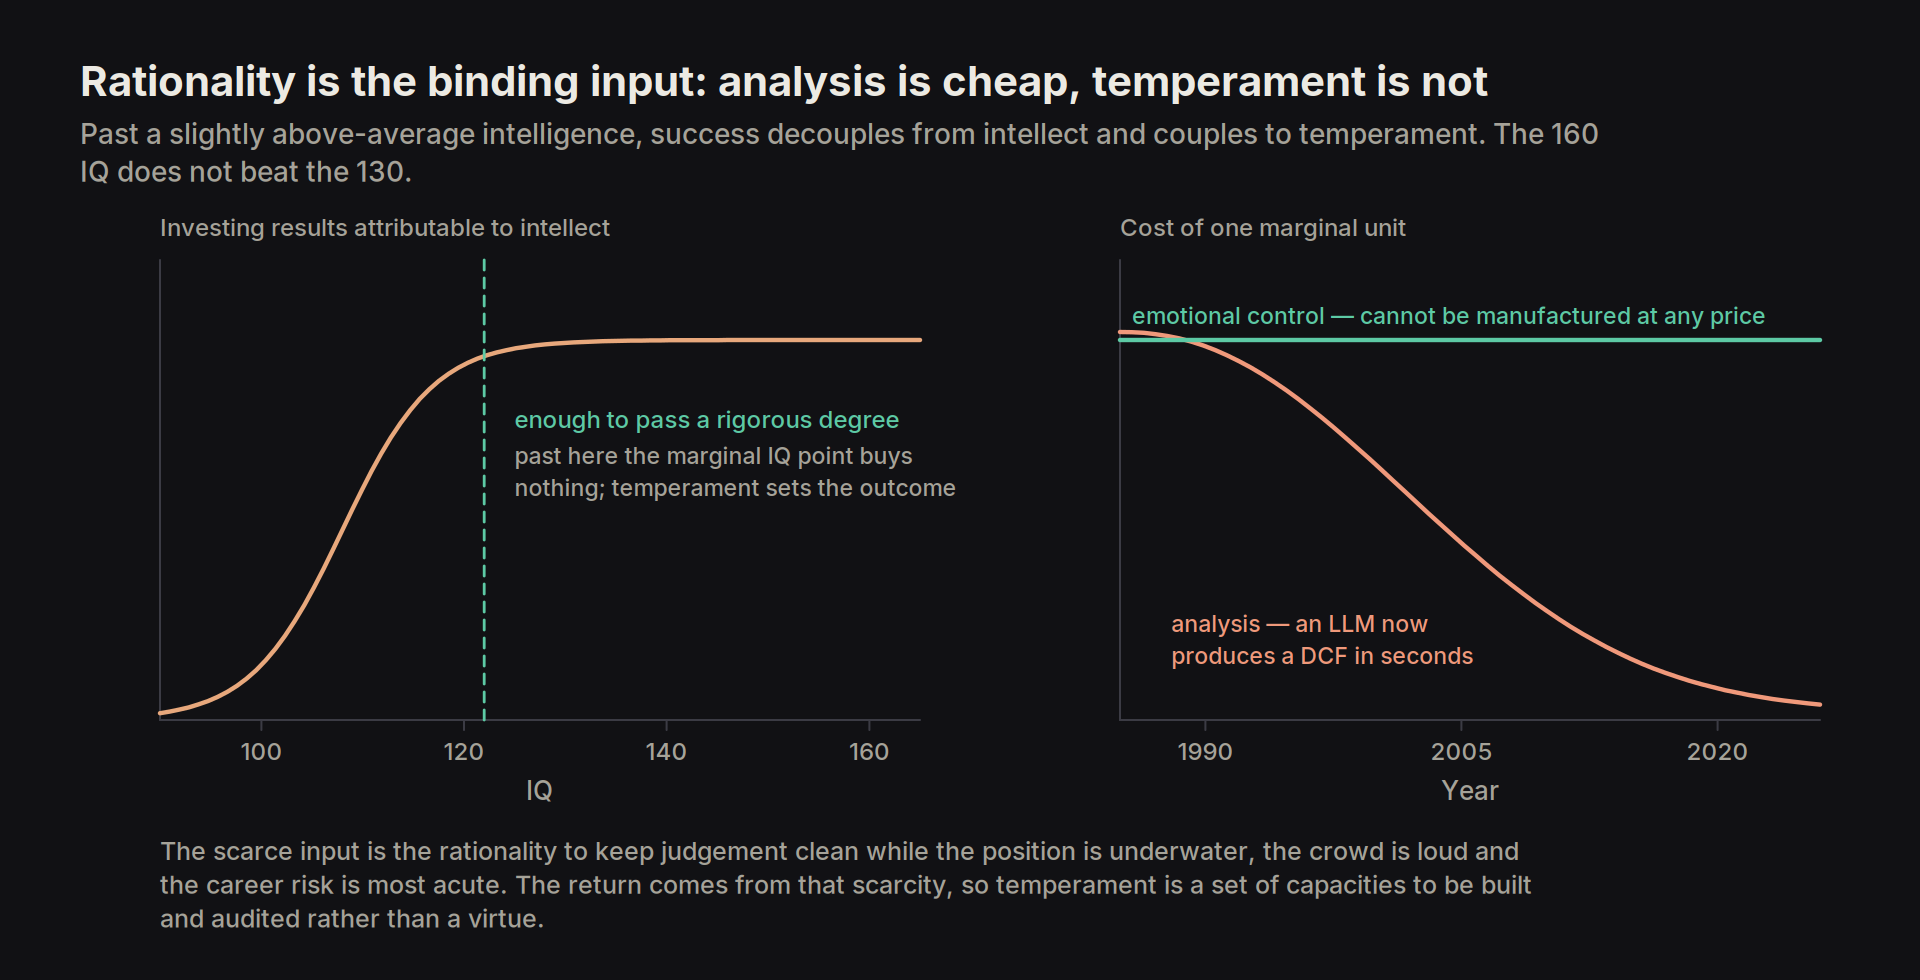
The binding constraint on above-average returns has never been exceptional analysis. Compounding, margin of safety and expected value are teachable in an afternoon, and the arithmetic of a discounted cashflow is liberally taught to university students and entry-level CFA candidates. The scarce input is the rationality to keep judgement clean while the position is underwater, the crowd is loud and the career risk is most acute. Since the return comes from that scarcity, temperament is treated here as a set of capacities to be built and audited rather than as virtues.
2.1 Rationality as the binding input
Buffett's view was that it is better to have a lower IQ and know it than a high IQ and overestimate it, and that once past a slightly above-average intelligence, enough to pass a rigorous university degree, success decouples from intellect and couples to temperament; his competitive statement of the same point, that investing is not a game where the man with the 160 IQ beats the man with the 130, should be taken literally. The marginal unit of analysis is cheap and getting cheaper (an LLM now produces a competent DCF in seconds), while the marginal unit of emotional control cannot be manufactured at any price. Success, in the words of the 1987 letter, comes from "coupling good business judgment with an ability to insulate his thoughts and behaviour from the super-contagious emotions that swirl about the marketplace," not from arcane formulae or computer programs.
The filter for rationality runs against a set of behavioural biases hardwired into every human mind. The reference list draws on Munger's catalogue of the psychology of human misjudgement and on Kahneman and Tversky:
- incentive-caused bias — people do what they are paid to do and believe what it pays them to believe; Munger's most powerful tendency. It shapes the sell side, the allocator and the manager alike, so the first question about any recommendation, including our own, is what the recommender is paid for;
- commitment and consistency bias, excessive self-regard and overoptimism — a stated position hardens into an identity and a published thesis hardens faster; we over-rate what we own and what we concluded ourselves; and what we wish, we tend to believe. Together they turn a hypothesis into a possession;
- loss aversion, the disposition effect and pain-avoiding psychological denial — losses hurt more than equivalent gains please, so they are avoided at irrational cost, and the avoidance takes three forms: selling winners early and holding losers; the desire to break even, which anchors the sell decision to the purchase price rather than to the present value; and the refusal to see evidence that the thesis is broken, because seeing it hurts. All three operate on the exit and none of them on the entry;
- deprival super-reaction — over-reacting to something being taken away;
- availability, anchoring and contrast-misreaction — over-weighting the vivid, the recent and the first number seen, and judging by comparison rather than in absolute terms, so a stock looks cheap against its peers when the whole peer group is expensive;
- social proof, misplaced deference to authority, and envy — the crowd and the expert as substitutes for the work, and the pain of watching others make money, which is what actually drives buying at the top;
- doubt-avoidance — rushing to a conclusion to end the discomfort of not knowing, which is why the too-hard pile has to be a deliberate act;
- reason-respecting and narrative and coherence bias — a stated reason is accepted even when it is a bad one, and a story feels true in proportion to how well it hangs together, so a fluent explanation from management or from a model is treated as evidence that it is not;
- and the halo effect — a rising share price makes the same organisation read as nimble and a falling one as complacent, so evidence on culture and management is dated before it is weighed.
An investor unable to name which of these is currently operating on him has established only that he lacks the instruments to detect it.
2.2 The cognitive apparatus
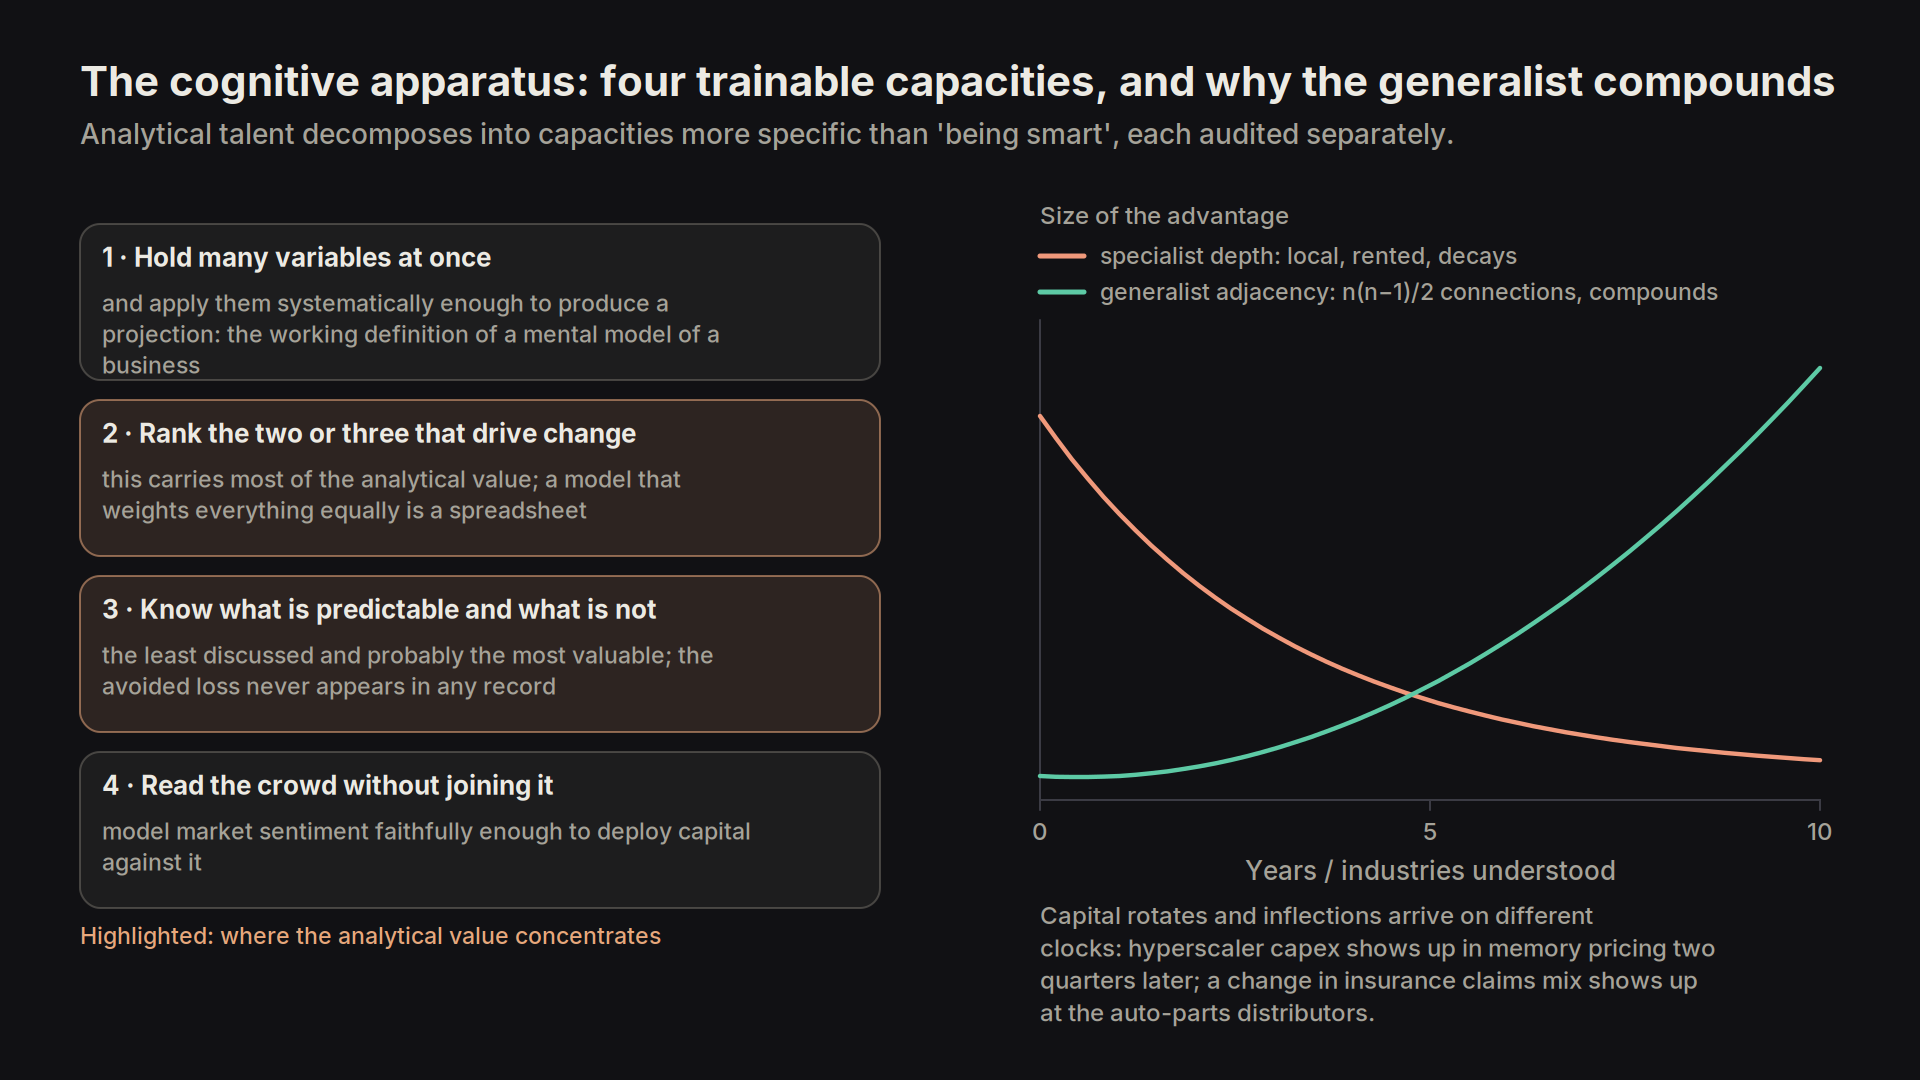
Analytical talent decomposes into capacities considerably more specific than 'being smart', and each can be trained and audited separately.
- The first is holding many variables in the mind at once and applying them systematically enough to produce a projection, which is effectively the working definition of having an accurate mental model of a business.
- The second is identifying which two or three of those variables actually drive change; this carries most of the analytical value, since a model that weights everything equally is a spreadsheet and the ranking is the output.
- The third is recognising when something is predictable and when it is not, the least discussed of the four and probably the most valuable. Correctly classifying a situation as unpredictable avoids a confident forecast that would otherwise have been acted on, and that avoided loss never appears in any performance record.
- The fourth is reading market dynamics and the sentiment of other participants accurately enough to deploy capital against them, which requires modelling the crowd faithfully while declining to join it, a harder combination than either half on its own
Munger's latticework of mental models supports the first two. The instruction is to master the big ideas of every key discipline and hang them on a mental grid so that the right tool is reached automatically.
A one-model mind is worse than useless: to a specialist holding one technique, every problem looks like the nail his hammer was built for, and he is generally most confident exactly where the model does not apply.
The generalist requirement follows from the same logic for a different reason. Capital rotates, and businesses in different areas reach inflection points on different clocks. The investor thus has to correlate information across industries and understand how a trend in one propagates into another (e.g. how hyperscaler capex plans show up in memory pricing two quarters later, or how a change in the mix of insurance claims shows up at the auto-parts distributors). A specialist's depth advantage is local and rented, in that it decays as the sell side catches up and it does not transfer; a generalist's adjacency advantage compounds, because every new industry understood raises the number of connections available to every industry already understood.
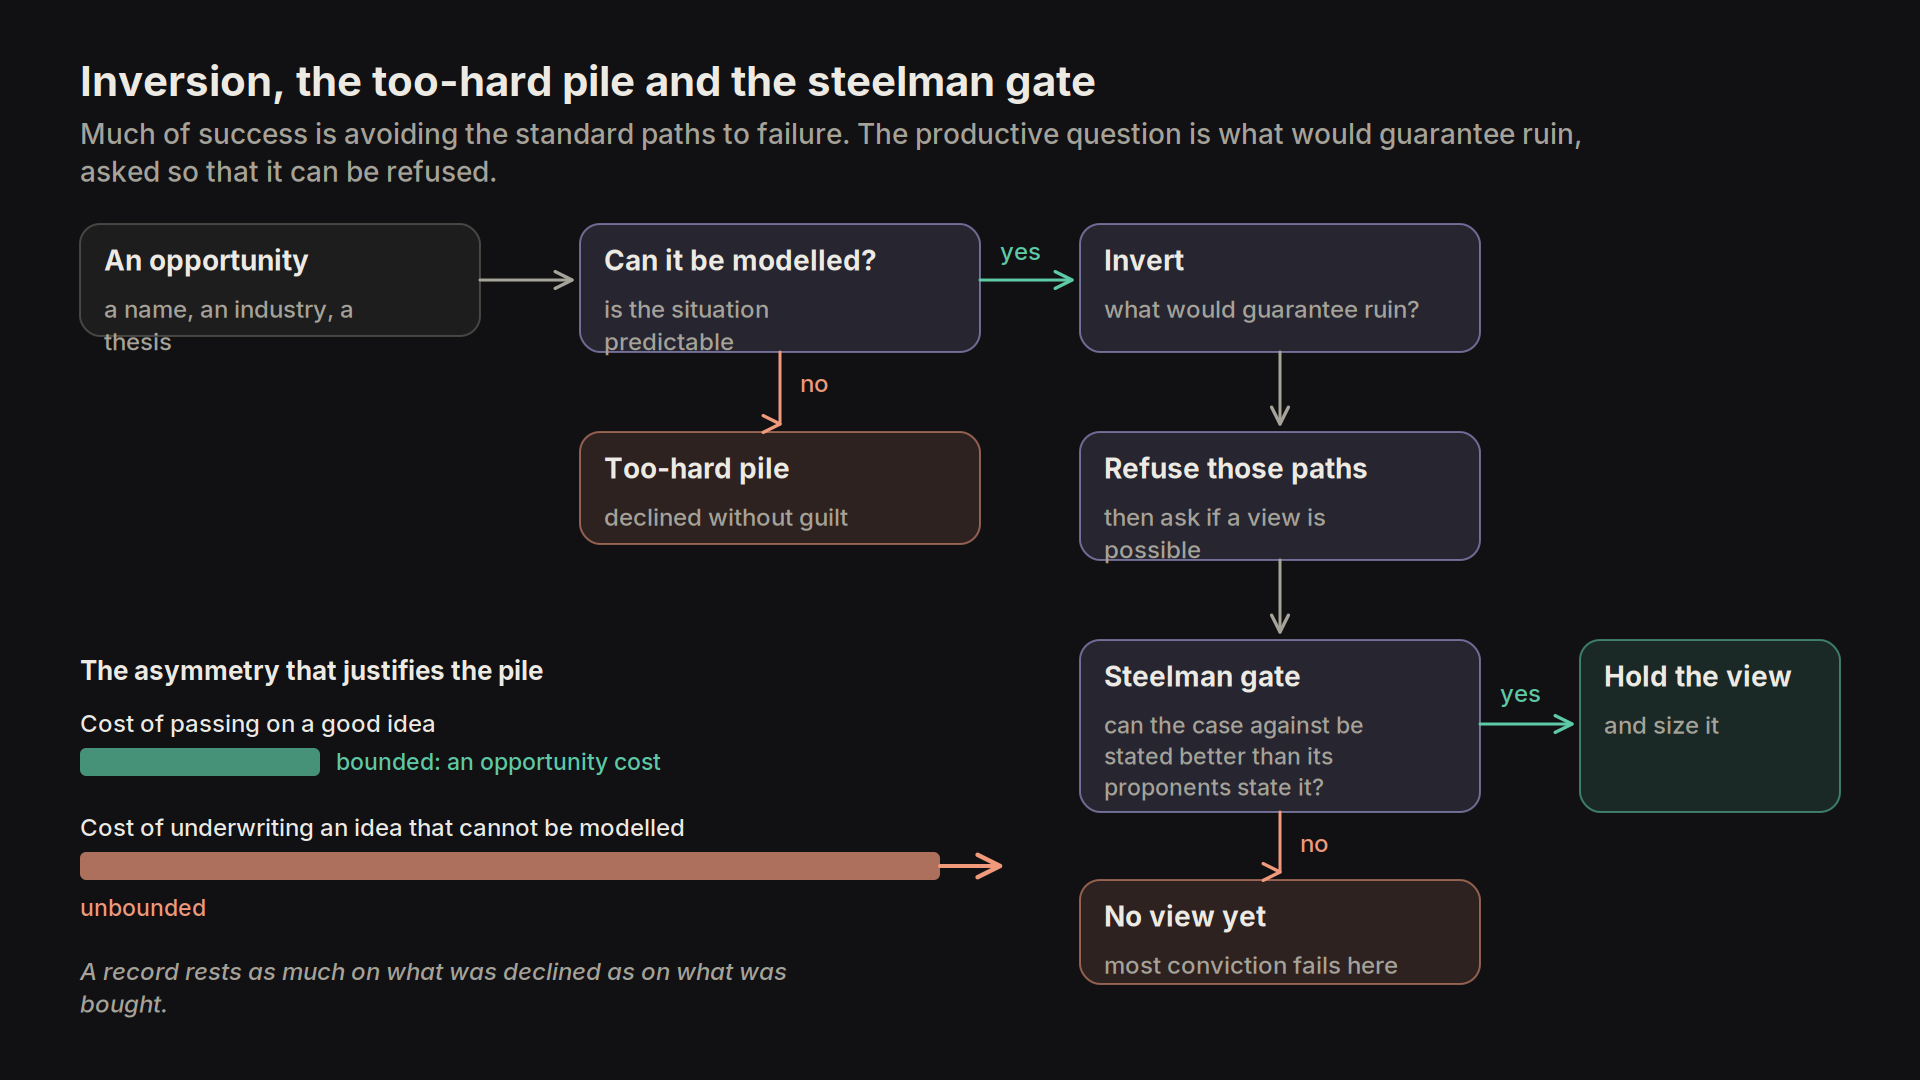
Separating the predictable from the unpredictable is put into practice through inversion and the too-hard pile. Much of success is avoiding the standard paths to failure, so the productive question is what would guarantee ruin, asked so that it can be refused, rather than what would guarantee a win (Jacobi's "invert, always invert"). Anything that resists analysis goes on the too-hard pile, without guilt, since a record rests as much on what was declined as on what was bought: the opportunity cost of passing on a good idea is bounded, while the cost of underwriting an idea that cannot be modelled is not. Where an opinion is formed at all, the gate is steelmanning: never hold a view until the arguments against it can be stated better than its proponents state them (Munger), a test that most conviction fails and that costs nothing to run.
2.3 Standing alone
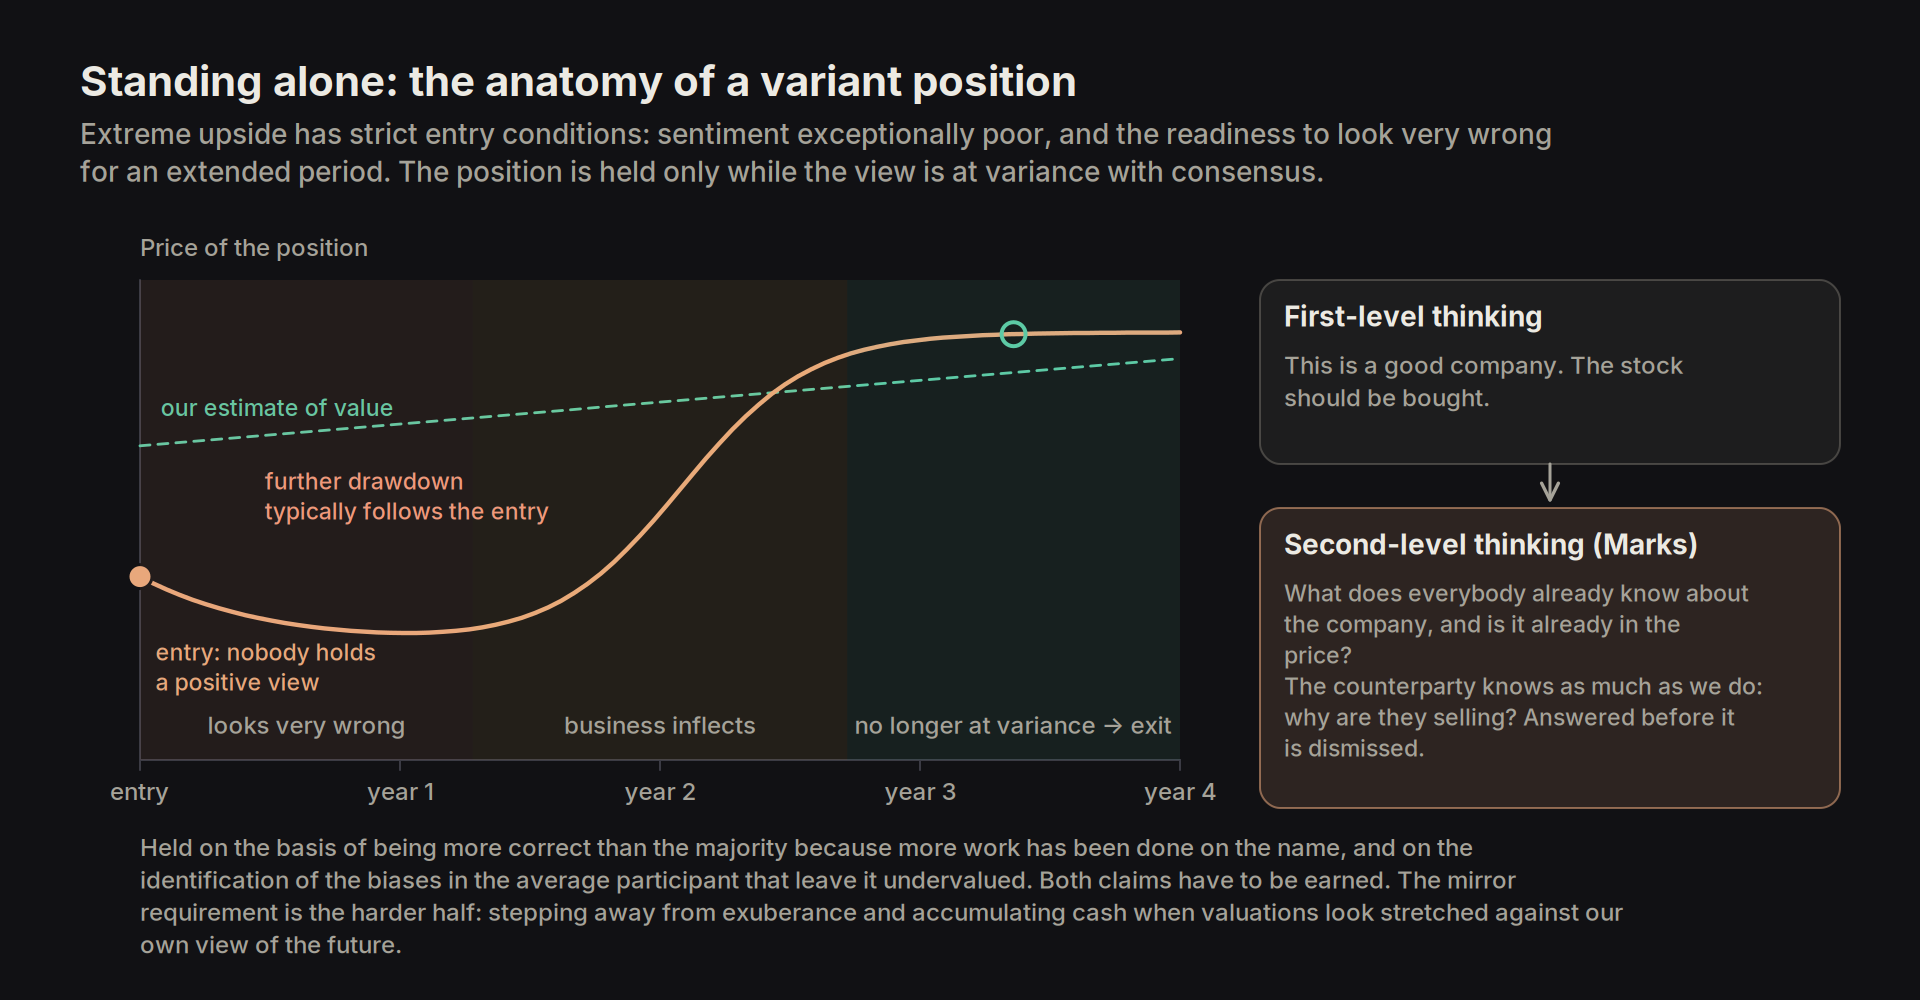
Any investment with extreme upside has strict entry conditions. Sentiment at entry must be exceptionally poor, and the investor must be ready to look very wrong, and to be labelled crazy, potentially for an extended period. The position is held on the basis of the investor viewing themself to being more correct than the majority because more work has been done on the name, and on the investor's identification of the biases in the average participant that leave the position undervalued; both are claims that have to be earned. These are deeply unnatural positions for the untrained mind to occupy.
Since a stock with positive momentum and a clean narrative is generally fairly valued already, an explosive return requires buying what nobody holds a positive view of and then having the business inflect, and hunting for those situations should therefore occupy the bulk of the time budget rather than the residue left after existing positions have been maintained.
This type of bizarre mental fortitude is the discipline the market punishes hardest, and so it has to be enforced by exceptional work discipline and cold rationality. This requires remaining objective and anchored to the long-term view while markets are irrational, and deploying capital aggressively into downturns rather than merely refusing to sell into them. Its mirror requirement is the harder half, stepping away from exuberance and accumulating cash when valuations look stretched, with 'stretched' defined against our own view of the future rather than against what the average market participant currently believes, since the whole exercise consists of trading against the average participant's view and that view cannot also be the benchmark for whether a trade is available.
Every position must express a view at variance with consensus, and it is held until the view is no longer at variance, which is a discipline for exits as much as for entries and rules out holding a name simply because it has worked. The gate is what Howard Marks calls second-level thinking: first-level thinking observes that this is a good company and concludes that the stock should be bought; second-level thinking asks what everybody already knows about the company and whether that knowledge is already in the price. The counterparty is assumed to know as much as we do, so the question of why they are selling is answered before it is dismissed.
2.4 Patience as arbitrage
The market moves on immediate gratification and speculative swings, so a long horizon is a structural arbitrage before it is a temperamental preference: it allows the pricing today of long-dated outcomes that short-horizon participants cannot hold even when they can see them, because their redemption terms and reporting cycles do not permit the drawdown along the way. The collapse of average holding periods, from roughly eight years in the mid-1950s toward months, is the measured size of that opportunity, and it has widened as information proliferation made the three-to-five-year datapoint easier to find and the one-to-six-month window more competitive.
Extracting the arbitrage requires card-table discipline: fold early when the odds are against, and when a genuine edge finally appears, back it heavily, because big edges come rarely and everything in between is friction. The market has no called strikes, which Buffett paired with his twenty-punch-card rule (a card with room for only twenty investment decisions in a lifetime), and that is what makes waiting simultaneously the return engine and the risk control; in Munger's phrase, the big money is in the waiting, not in the buying and the selling. Extreme patience punctuated by rare decisiveness beats constant activity by a margin that grows with the number of participants, since every additional participant raises the cost of activity and lowers the cost of stillness.
The waiting period is not idle, however, and the capacity that fills it is curiosity of the unquenchable kind: the discipline never to rest, to keep improving the understanding of everything relevant whether or not an opportunity is currently available, to read the filings of companies that will never be bought because they are the counterparties, suppliers and customers of the ones that will, and to treat every industry not yet understood as a gap to be repaired. The optionality of the next decade's positions is stored in the homework of the years before, and a manager who begins researching an industry at the moment it becomes cheap is already too late.
Part Three — The practical craft: groundwork, industry maps, moats and cycles
Variant perception is earned before it is traded, since the market's error is rarely ignorance of a datapoint, the datapoint being generally in the filing and on the tape; it is the absence of a model in which the datapoint matters. Building that model is the work that fills the years before an investment is actually made.
3.1 The groundwork
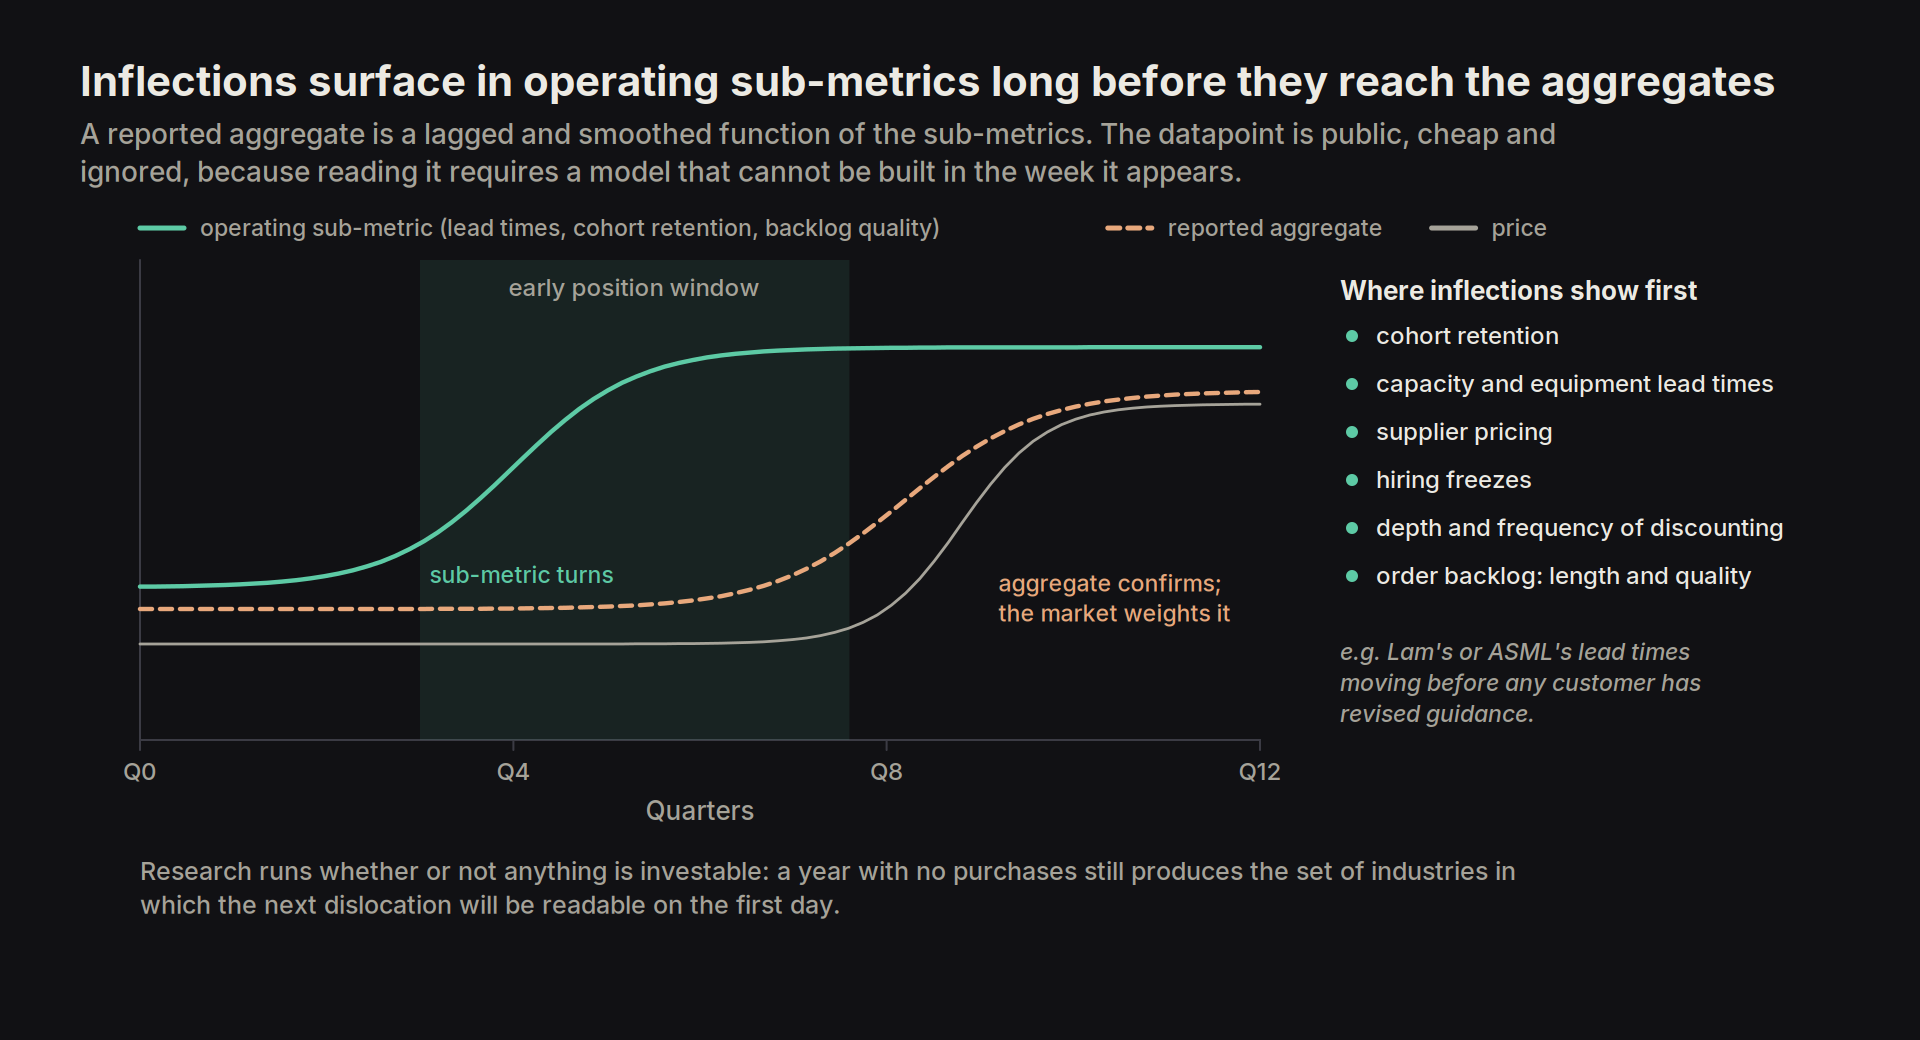
Active research is a permanent state rather than a phase that opens when a name becomes interesting, because developing a perception at variance with consensus requires understanding an industry, a business-model transition or a value-chain shift better than the rest of the community understands it, and that standard cannot be met by starting when the price moves; the research thus runs whether or not anything is currently investable, and a year with no purchases still produces an output, namely the set of industries in which the next dislocation will be readable on the first day.
This pays because inflections announce themselves in optically minor datapoints long before they announce themselves in results. A signal that looks insignificant to an undiscerning reader is often the herald of a large shift for whoever holds the model that gives it meaning, and this asymmetry is effectively the entire reason an early position can exist. The datapoint is public, cheap and ignored, and it is ignored because reading it requires context that cannot be acquired in the week it appears. Mechanically, inflections surface first in operating sub-metrics and only later in the aggregates: in cohort retention, capacity lead times, supplier pricing, hiring freezes, the depth and frequency of discounting, the length of the order backlog and the quality of what is in it (e.g. Lam's or ASML's lead times moving before any customer has revised guidance). A reported aggregate is a lagged and smoothed function of those sub-metrics.
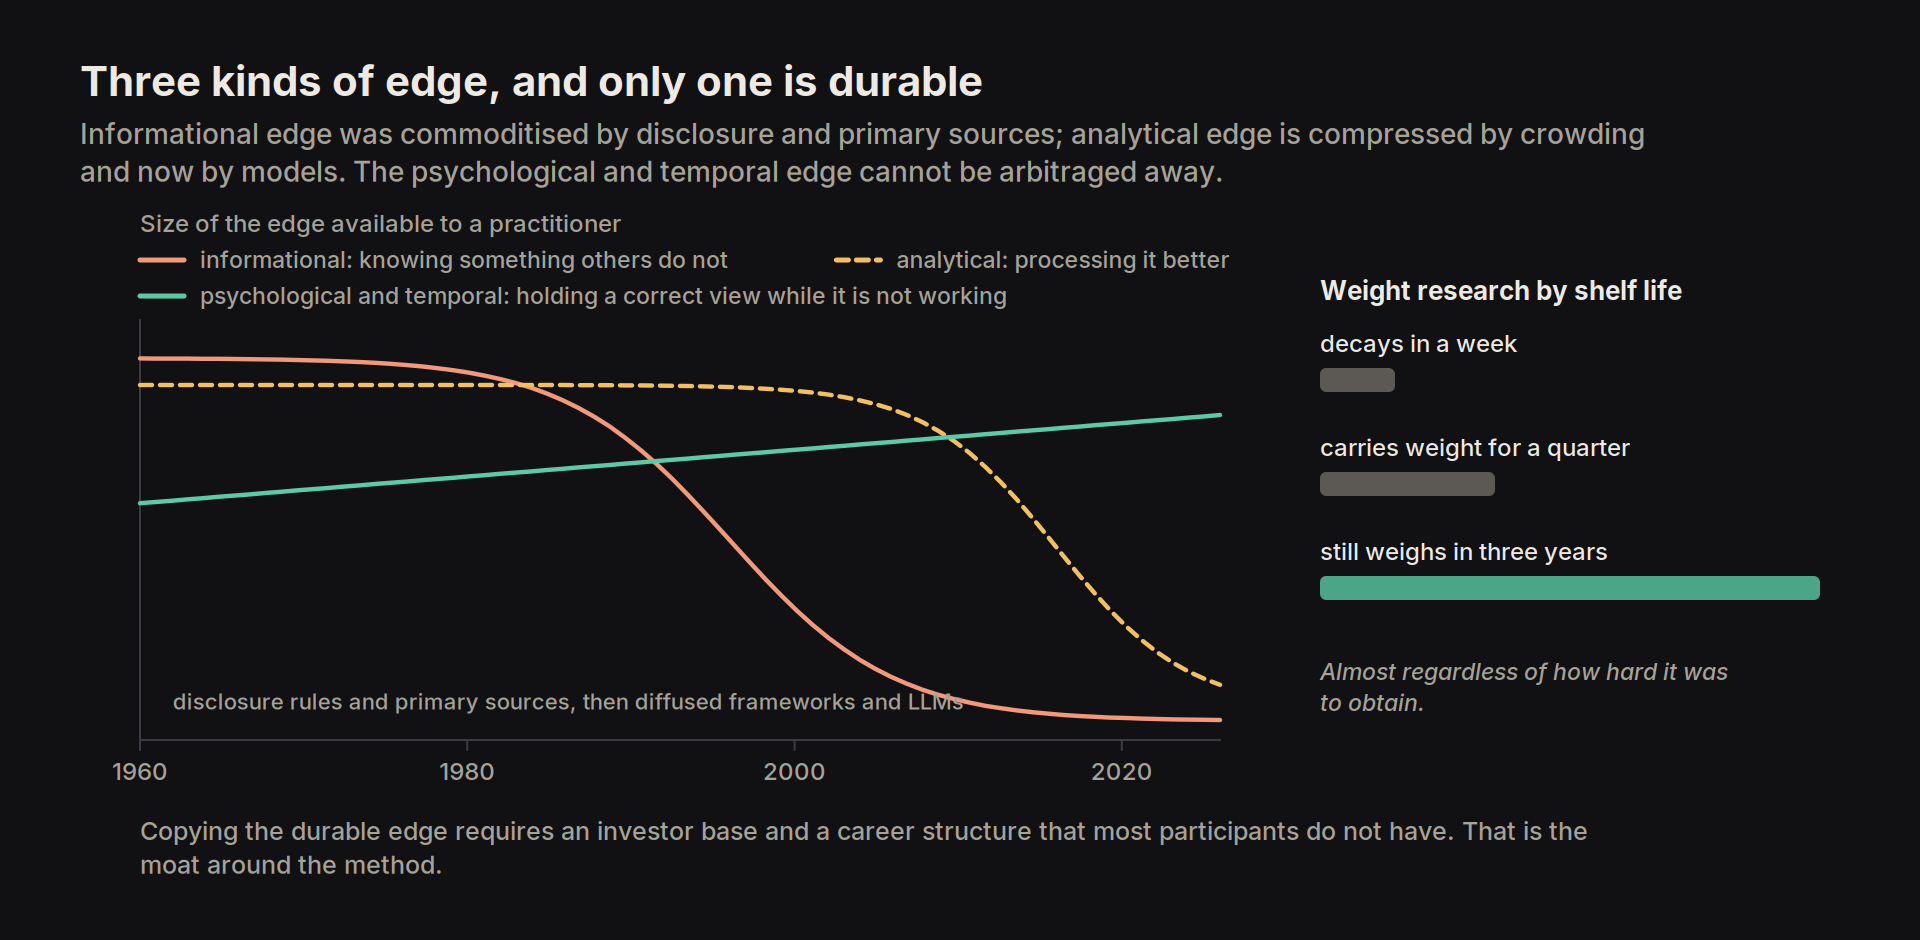
The edges available for capturing this fall into three types, and only one is durable.
- Informational edge, knowing something others do not, has been commoditised by disclosure rules and by the sheer availability of primary sources.
- Analytical edge, processing the same information better, is compressed by crowding in the most common analytical frameworks, since techniques diffuse and the returns to any framework fall as the number of practitioners rises.
- The psychological and temporal edge endures: the willingness to hold a correct view through a period in which it is not working cannot be arbitraged away, because copying it requires an investor base and a career structure that most participants do not have. The practical corollary is to weight research by the shelf life of the information it produces. A datapoint that decays in a week is worth less to us than one that will still carry weight in three years, almost regardless of how hard it was to obtain
3.2 The industry map before the name
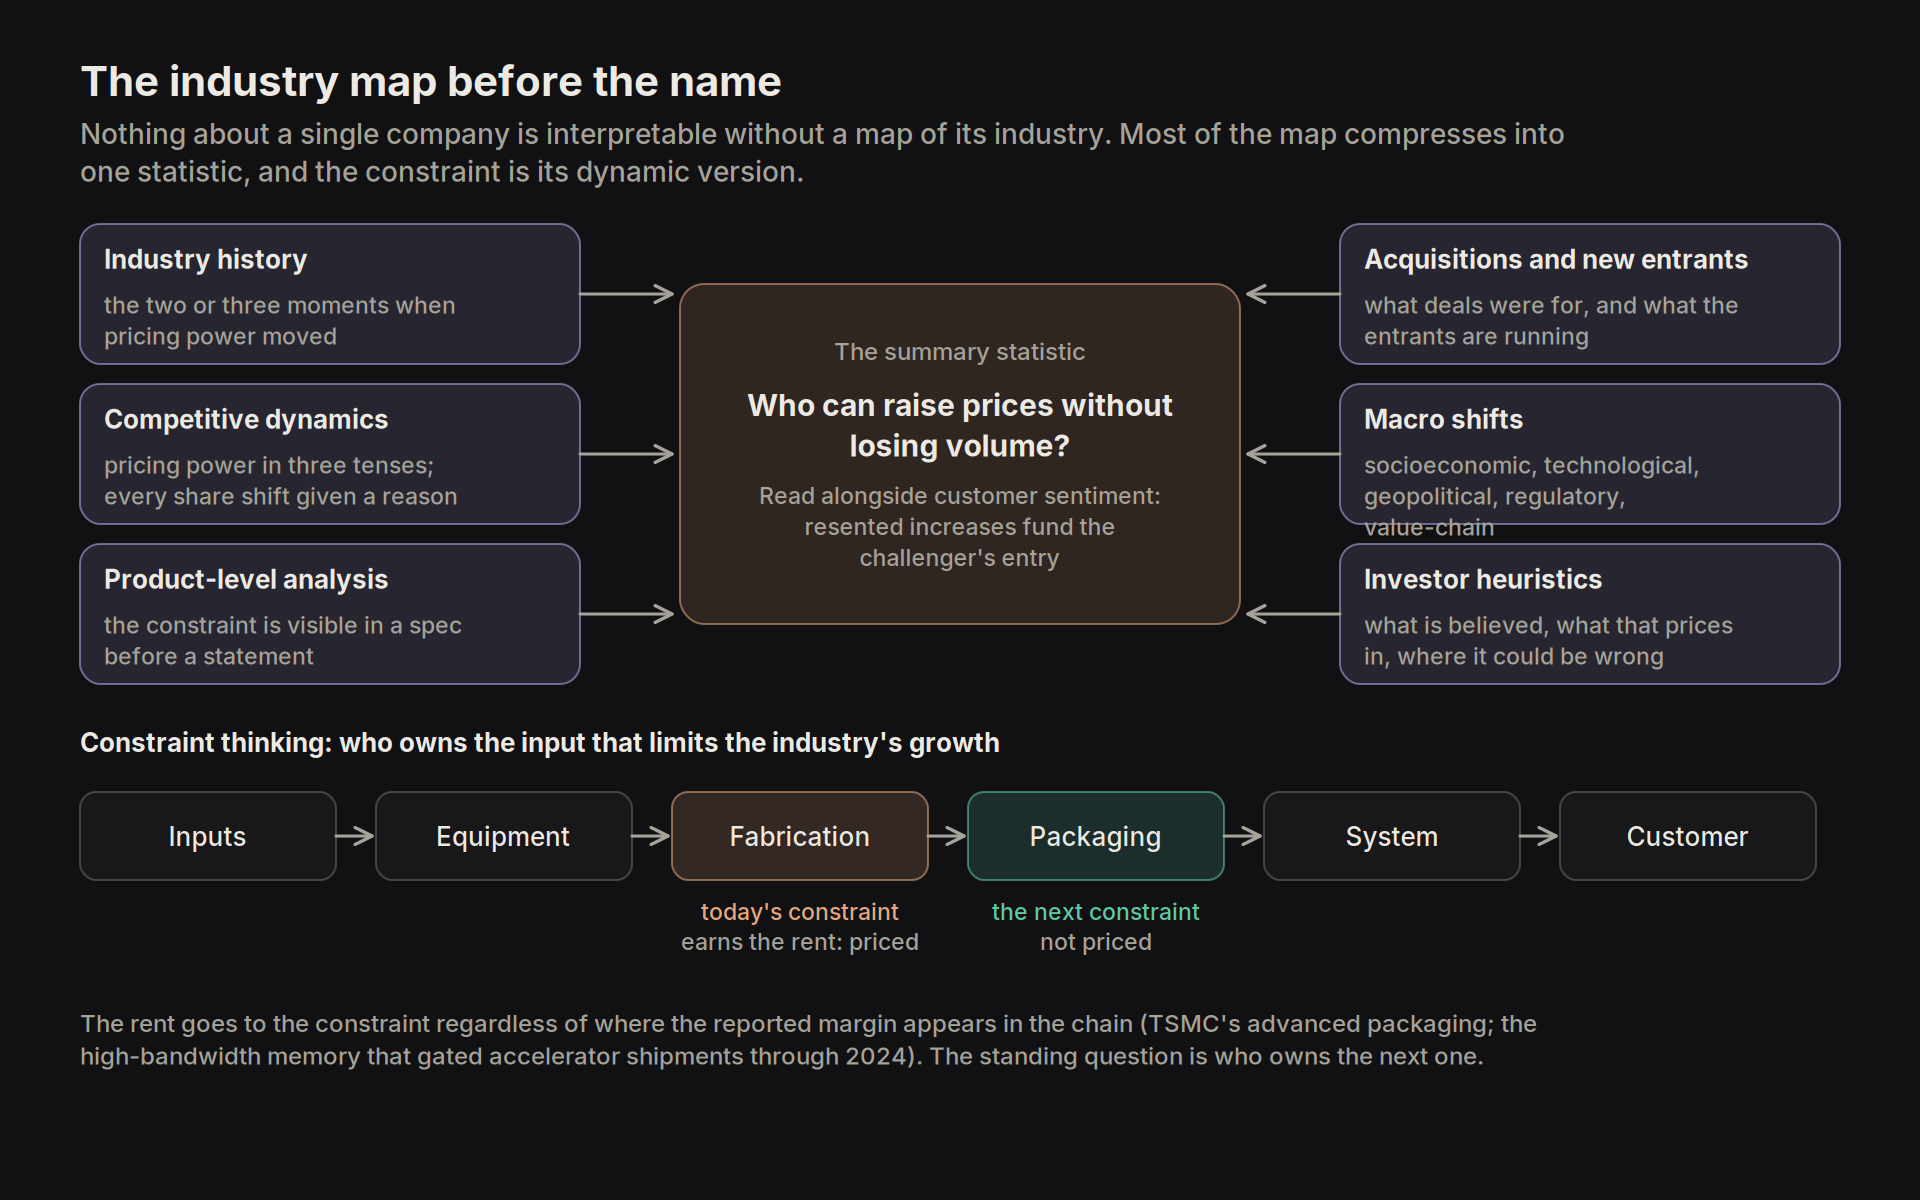
Nothing about a single company is interpretable without a map of the industry it operates in, so the map is built first. The questions are structural: where value enters the industry, where it accumulates once inside, which constraint currently limits growth, how competitors respond when that constraint eases, and what would move it. A company is then evaluated as a position on that map. A business earning high returns because it holds a structural position can thus be distinguished from one earning high returns because the industry is temporarily short of capacity.
Most of the map compresses into a single summary statistic, which is who can raise prices without losing volume, and the trajectory of that statistic along the value chain shows where bargaining power is migrating. Price increases that customers resent, as opposed to those they absorb, build up negative goodwill that invites disruption and effectively funds the challenger's entry, so realised pricing power has to be read alongside customer sentiment; the profit and loss account alone does not carry it. Constraint thinking is the dynamic version of the same idea. At any moment one input limits the industry's growth, whether capacity, skilled labour, capital, a technical standard or regulatory permission. Whoever owns that input earns the scarcity rent regardless of where the reported margin appears in the chain (e.g. TSMC's advanced packaging, or the high-bandwidth memory supply that gated AI accelerator shipments through 2024). The standing question is thus not who owns the constraint now, which is priced, but who owns the next one when this one eases, which generally is not.
Every industry map should contain the following elements:
- Industry history. The industry is traced from its origin, and each major incumbent is followed back to its founding. The purpose is to identify the handful of moments when pricing power moved, when the industry consolidated or when new entrants proliferated, and how the technological, regulatory and cultural transitions of the time were handled. Most of what looks like a stable structure today is the residue of two or three of those moments, and knowing which ones tells us what kind of event moves the structure next.
- Competitive dynamics. The present state of play between the key players: how durable the incumbents are, how real the threat of new entrants is, and what strategic shifts in product or business model are under way. Pricing power is tracked in three tenses, historical, current and forward, and every past shift in market share is given a reason, because a share shift with no explanation is a gap in the map.
- Product-level analysis. The technical specifications, the market purpose and the reason for success of each incumbent's highest-volume products. The constraint that binds an industry is usually visible in a product specification (e.g. a lithography wavelength, a memory bandwidth, a regulatory certification) long before it is visible in a financial statement.
- Acquisitions and new entrants. What the major acquisitions were for, whether they delivered, and what business model, go-to-market or technology strategy the new entrants are running. The question at the end of this section is whether any of it weakens the incumbents' pricing power, which is the summary statistic from above tested against the live competitive record.
- Macro shifts. The variables inside or outside the industry that are currently driving material change or are expected to: socioeconomic, technological, geopolitical, regulatory, and shifts in the value chain upstream or downstream.
- Investor heuristics. What investors currently believe about the industry, what that belief implies is priced in, and where, on the evidence of the sections above, the belief could be wrong. Any non-consensus insight the research has produced is recorded here as an explicit claim, so that it can be tested rather than remembered.
3.3 Identifying and quantifying the moat
A moat is a claim about duration. A company that earns its cost of capital for perpetuity is worth its liquidation value. Any premium upon that liquidation value embed a competitive advantage period (CAP), the number of years over which the market believes the business will earn returns above its cost of capital. Because a discounted cashflow buries most of its value in the terminal assumption, the implied CAP, and its direction, is the variable actually being traded. The extraction is mechanical: extend the years of excess return in the forecast until the DCF equals the current price, and read off how many years the market is paying for. A worked case shows what the market is actually paying for. The table holds a ten per cent cost of capital and a fifty per cent reinvestment rate constant, lets the return on capital fade to the cost of capital at the end of the period, and reads off the warranted multiple of current earnings for each length of moat:
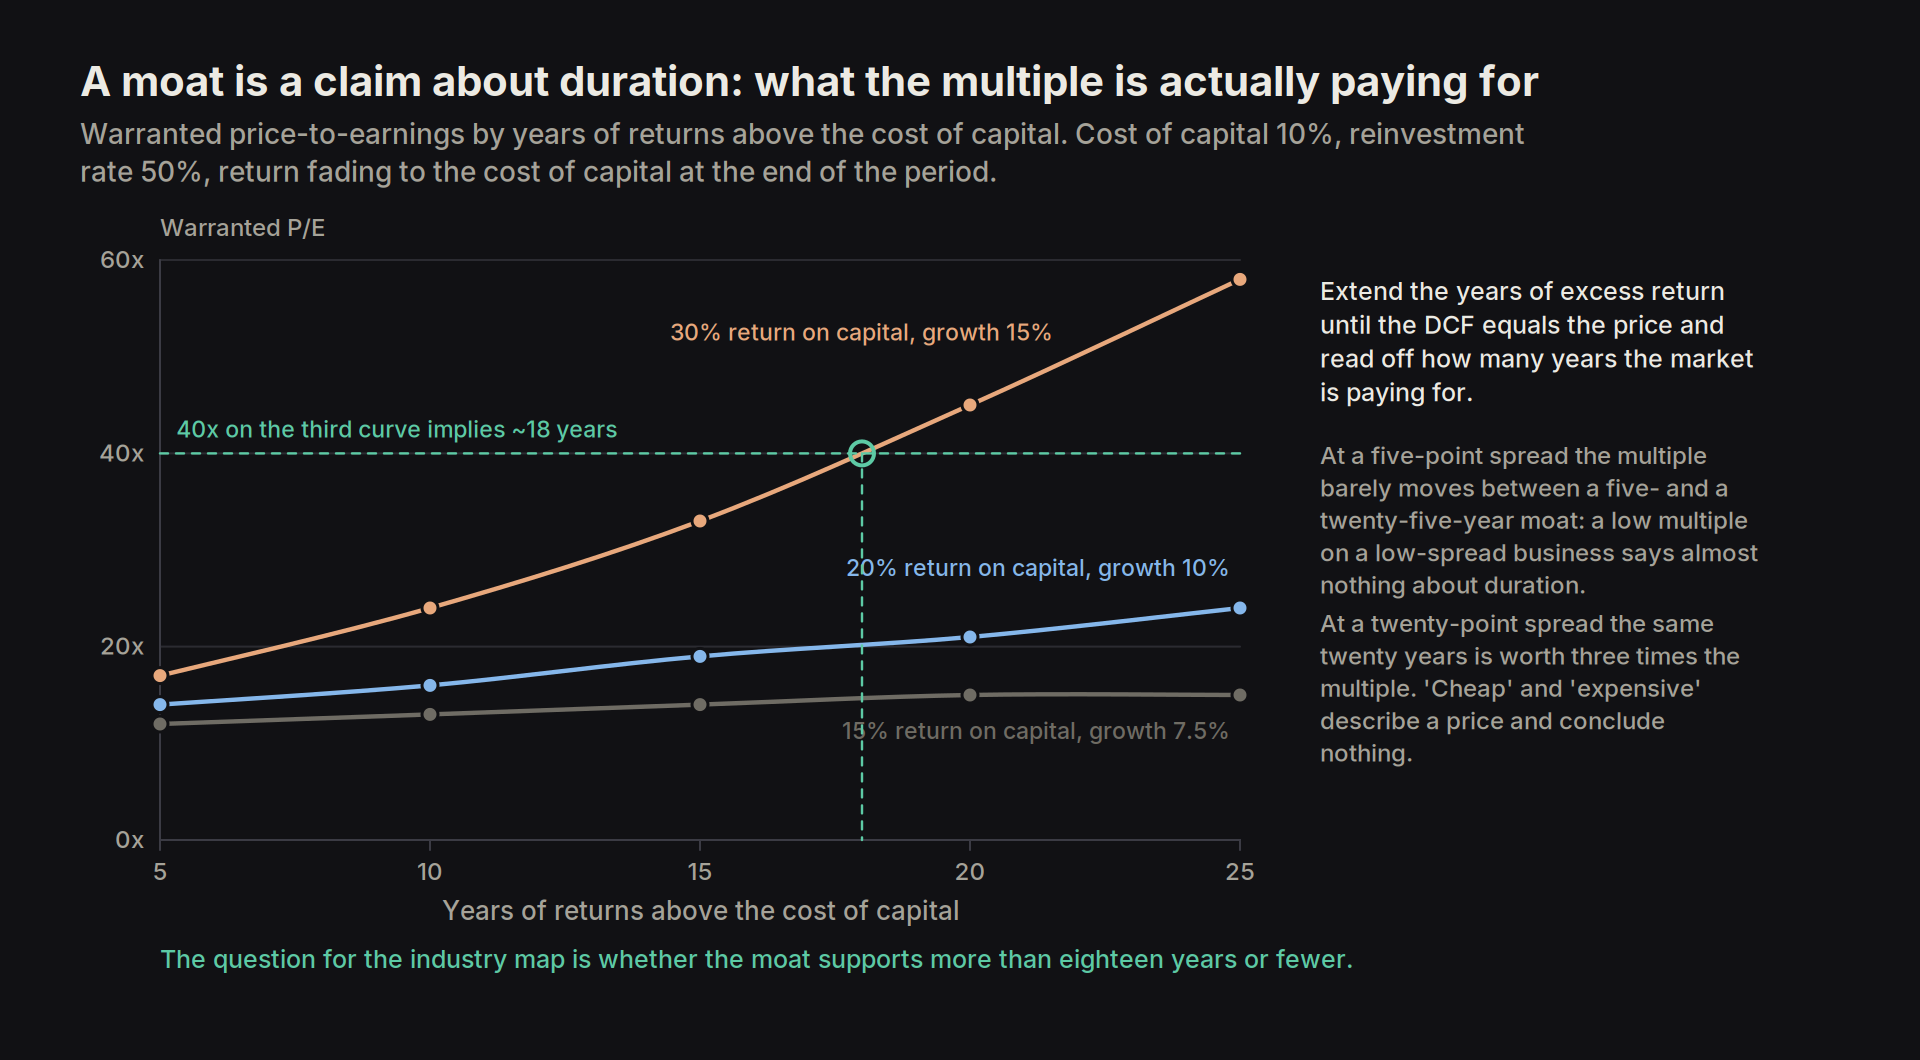
| Years of returns above the cost of capital | Warranted P/E at 15% return on capital (growth 7.5%) | Warranted P/E at 20% return on capital (growth 10%) | Warranted P/E at 30% return on capital (growth 15%) |
|---|---|---|---|
| 5 | 12x | 14x | 17x |
| 10 | 13x | 16x | 24x |
| 15 | 14x | 19x | 33x |
| 20 | 15x | 21x | 45x |
| 25 | 15x | 24x | 58x |
On the assumptions in the third column a price of forty times earnings implies roughly eighteen years of returns above the cost of capital, and the question for the industry map is whether the moat supports more than eighteen or fewer. The first column is why a low multiple alone says nothing about a moat: at a five-point spread the warranted multiple barely moves between a five-year and a twenty-five-year moat, so a low multiple on a low-spread business conveys almost nothing about duration, while at a twenty-point spread the same twenty years is worth three times the multiple, the same convexity working in reverse. A high multiple can understate a fifteen-year moat and a low multiple can overstate earnings built on temporary scarcity, so 'cheap' and 'expensive' describe a price and conclude nothing.
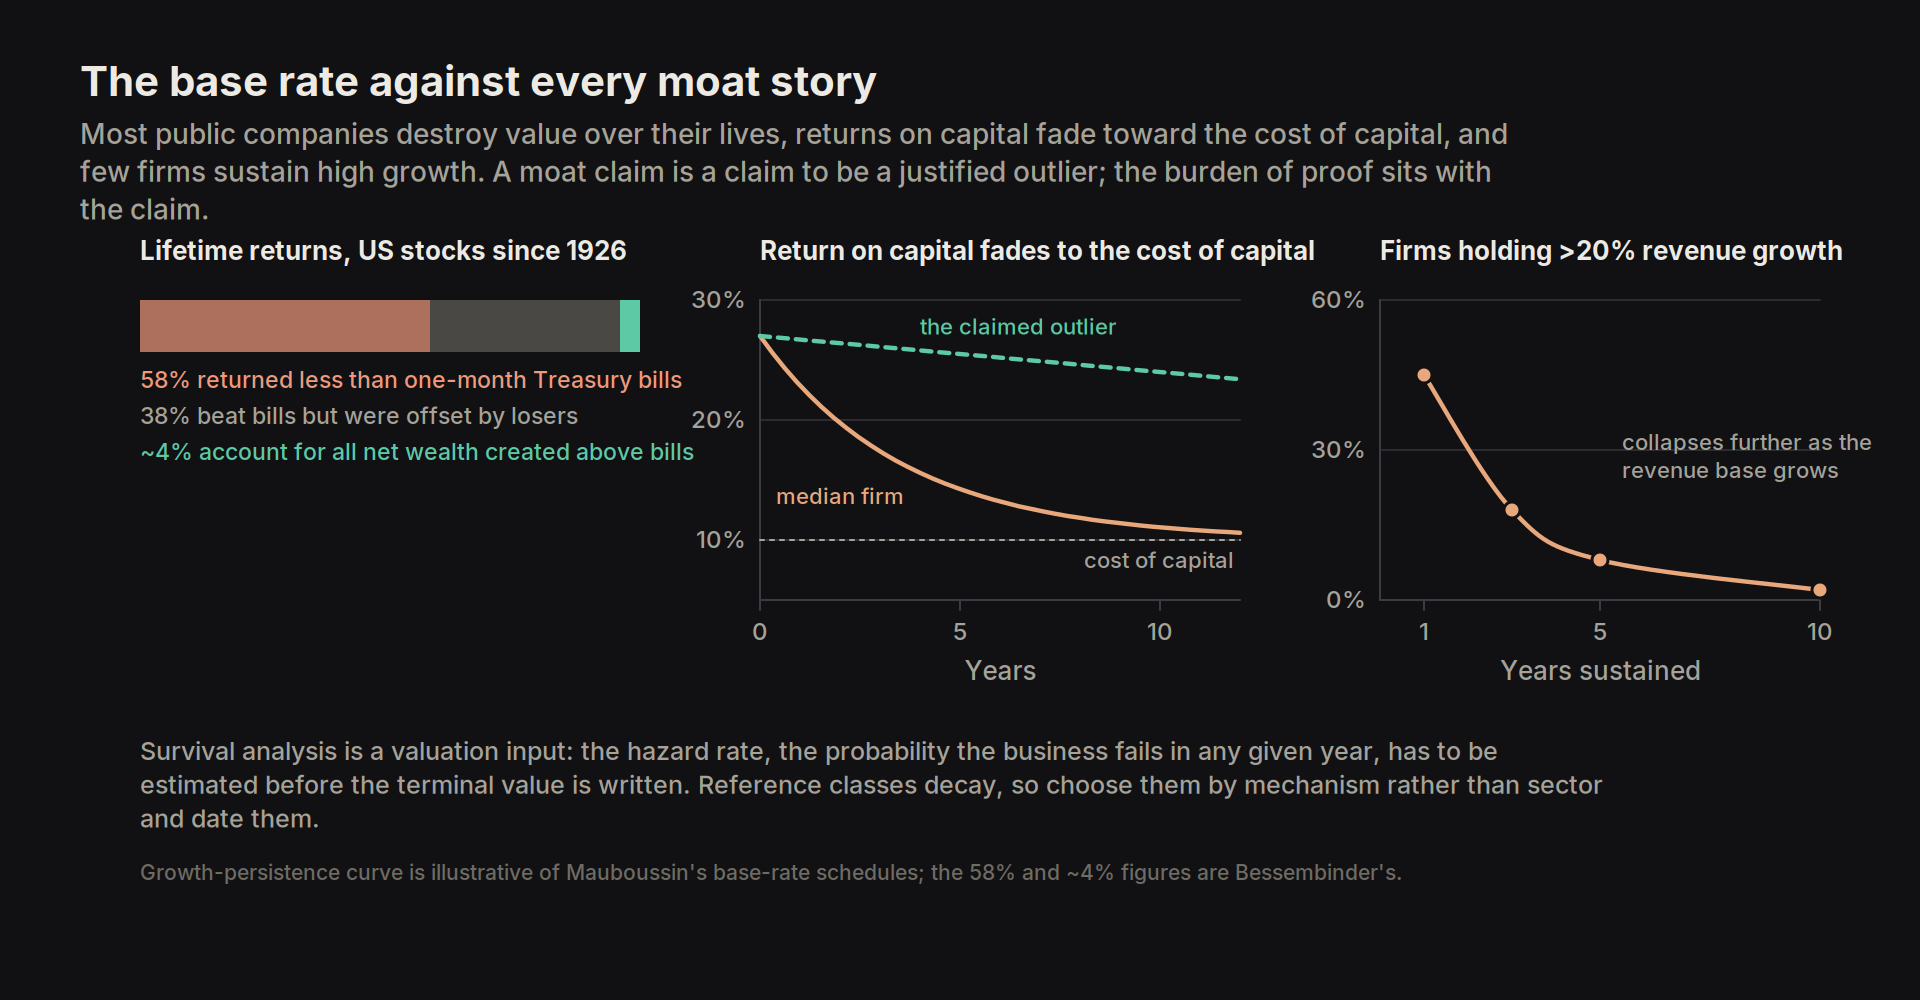
The base rate against every moat story is that most US public companies destroy value over their lives: Bessembinder's census of the market from 1926 finds that a majority of listed stocks (58 per cent) returned less than one-month Treasury bills over their lifetimes, and Mauboussin's base-rate work gives the fade schedule that the table above holds constant, with returns on capital reverting toward the cost of capital over roughly a decade for the median firm, and only a small minority of firms sustaining revenue growth above twenty per cent for ten years, a share that collapses further as the revenue base grows. Survival analysis is therefore a valuation input, and the hazard rate (the probability that the business fails in any given year) has to be estimated before the terminal value is written; a moat claim is a claim to be a justified outlier to those schedules, and the burden of proof sits with the claim.
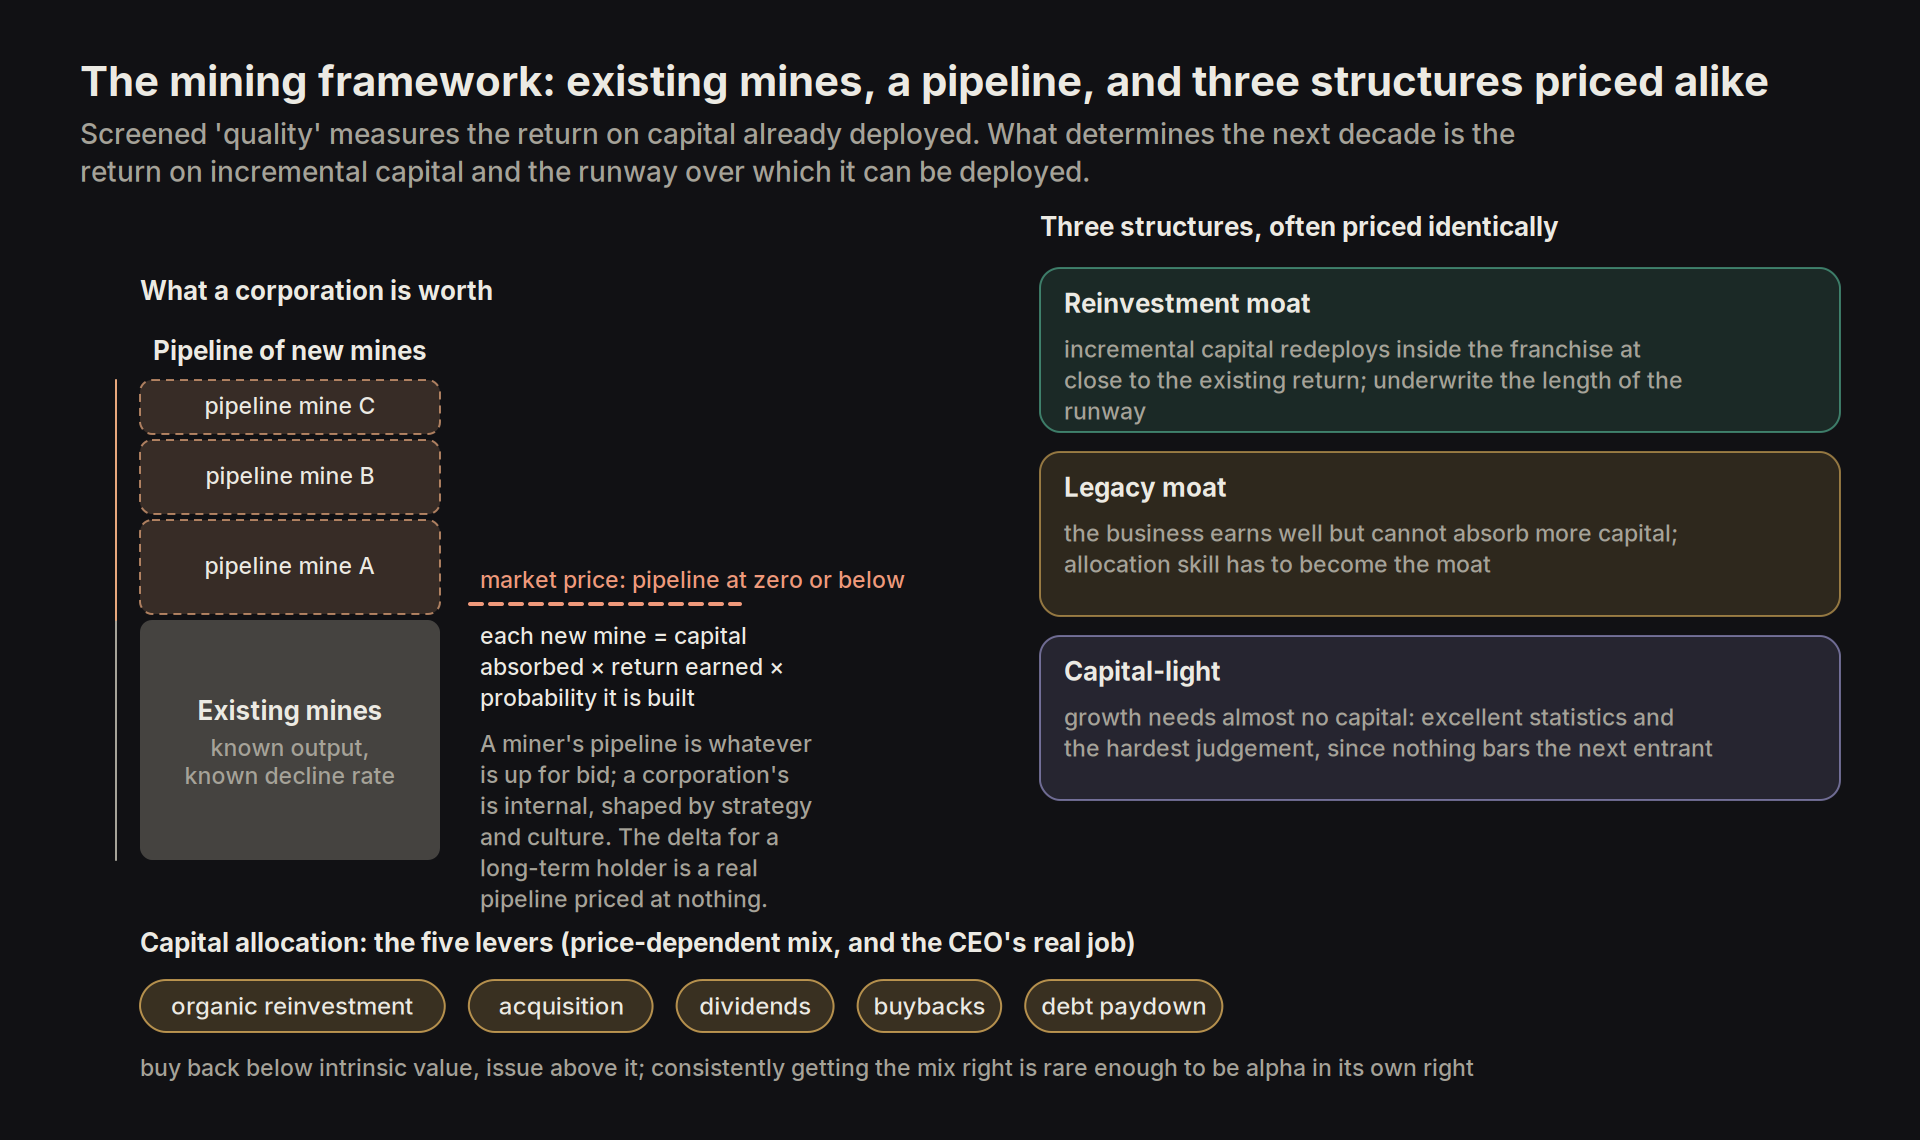
Screened 'quality' measures the return on capital already deployed, which describes the existing business.
What determines the next decade is the return on incremental capital and the runway over which incremental capital can be deployed at above-market rates, and the mining company is the cleanest model of the distinction: a miner is worth its existing mines, whose output and decline rate are known, plus a pipeline of new mines, each worth the capital it will absorb multiplied by the return it will earn multiplied by the probability it is ever built, and the same decomposition applies to any corporation, with the difference that a miner's pipeline is whatever is available to bid for while a corporation's pipeline is internal, company-specific and shaped by its strategy and culture.
Current return on capital thus describes the existing mines; the strategy, the culture and the industry's capacity for change describe the pipeline, and the delta available to a long-term investor is a company whose pipeline is real and is being priced at nothing or at a negative value.
The structures available differ enough that the market often prices them identically while they are worth entirely different amounts.
- In a reinvestment moat, incremental capital redeploys inside the franchise at rates close to the existing return, and the length of the runway is the variable to underwrite.
- In a legacy moat, the existing business earns well but cannot absorb more capital, so allocation skill has to become the moat, and the analysis shifts from industry structure to the five levers of organic reinvestment, acquisition, dividends, buybacks and debt paydown. The optimal mix of those levers depends on the price of the shares and of the alternatives, and consistently getting it right is rare enough to be a durable source of alpha in its own right.
- In the third structure, growth requires almost no capital at all. That produces excellent statistics and requires the hardest judgement, since the same absence of capital intensity that produces the returns also removes the barrier to the next entrant.
3.4 Examples that generate a competitive advantage period
Many mechanisms produce a durable competitive advantage period, and the strongest positions generally run more than one at once. Three examples are set out here because they are the ones the market most often misprices.
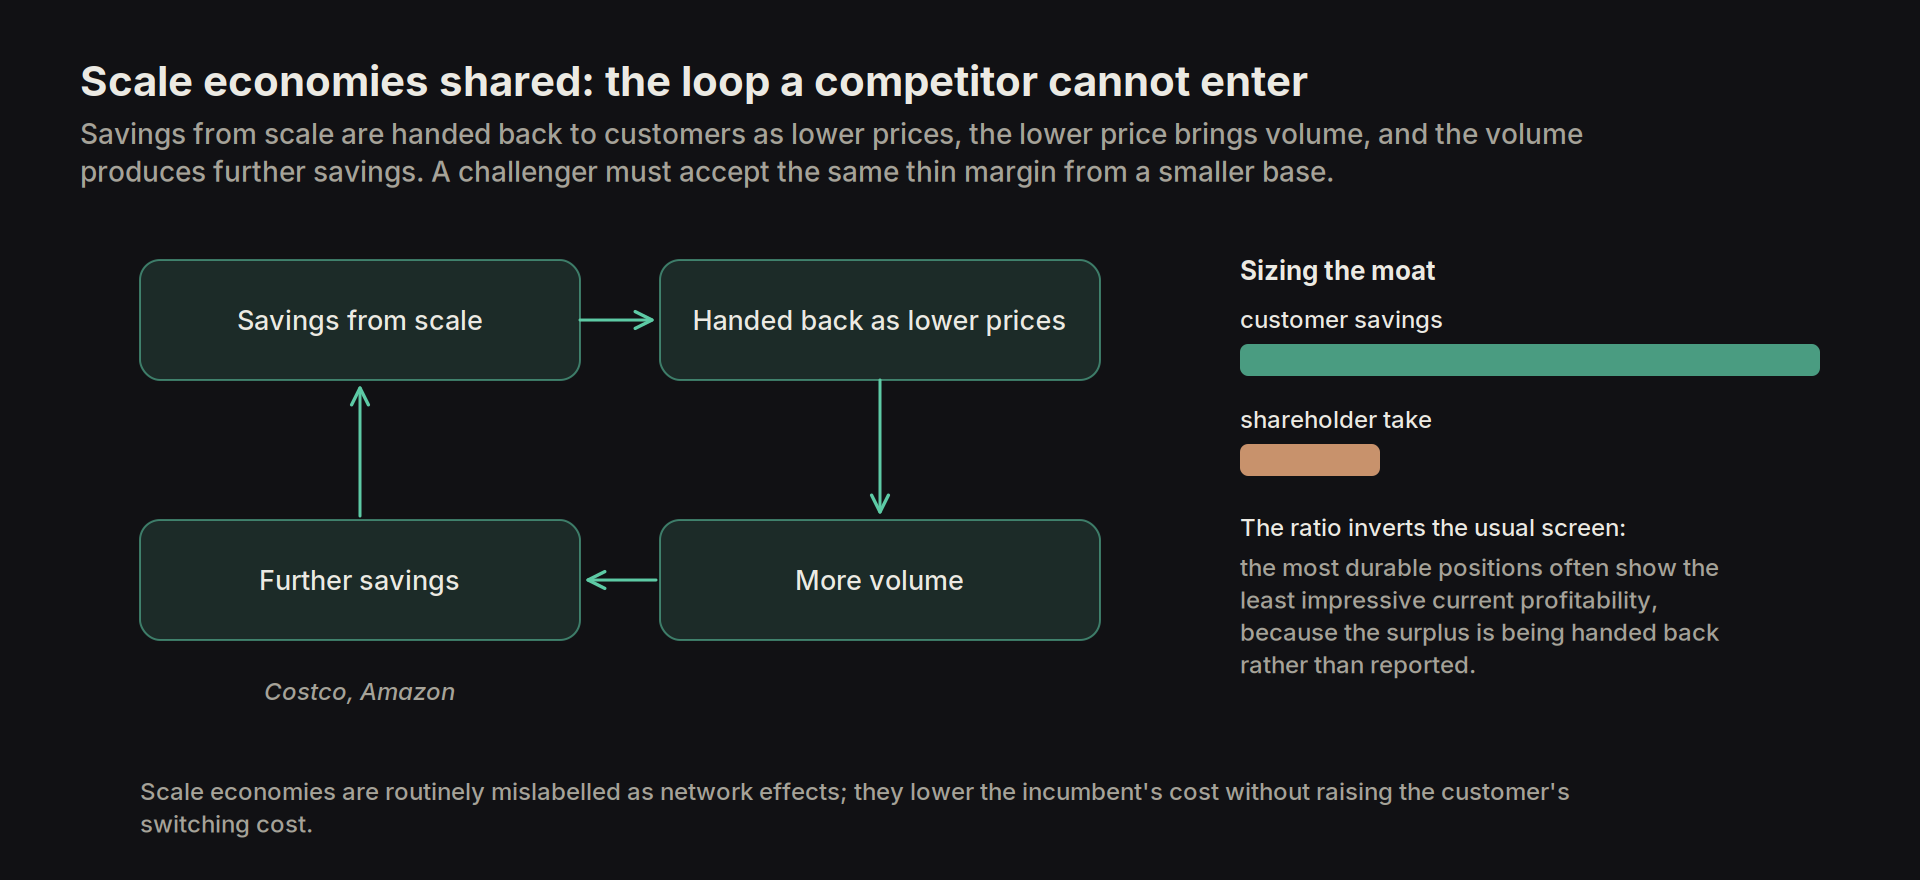
The first is scale economies shared. Savings from scale are handed back to customers as lower prices, the lower price brings more volume, the volume produces further savings, and the loop compounds into a position that a competitor cannot enter without accepting the same thin margin from a smaller base (Costco and Amazon are the canonical cases). The moat is sized by the ratio of customer savings to shareholder take, which inverts the usual screen: the businesses with the most durable positions often show the least impressive current profitability, because they are handing the surplus back rather than reporting it.
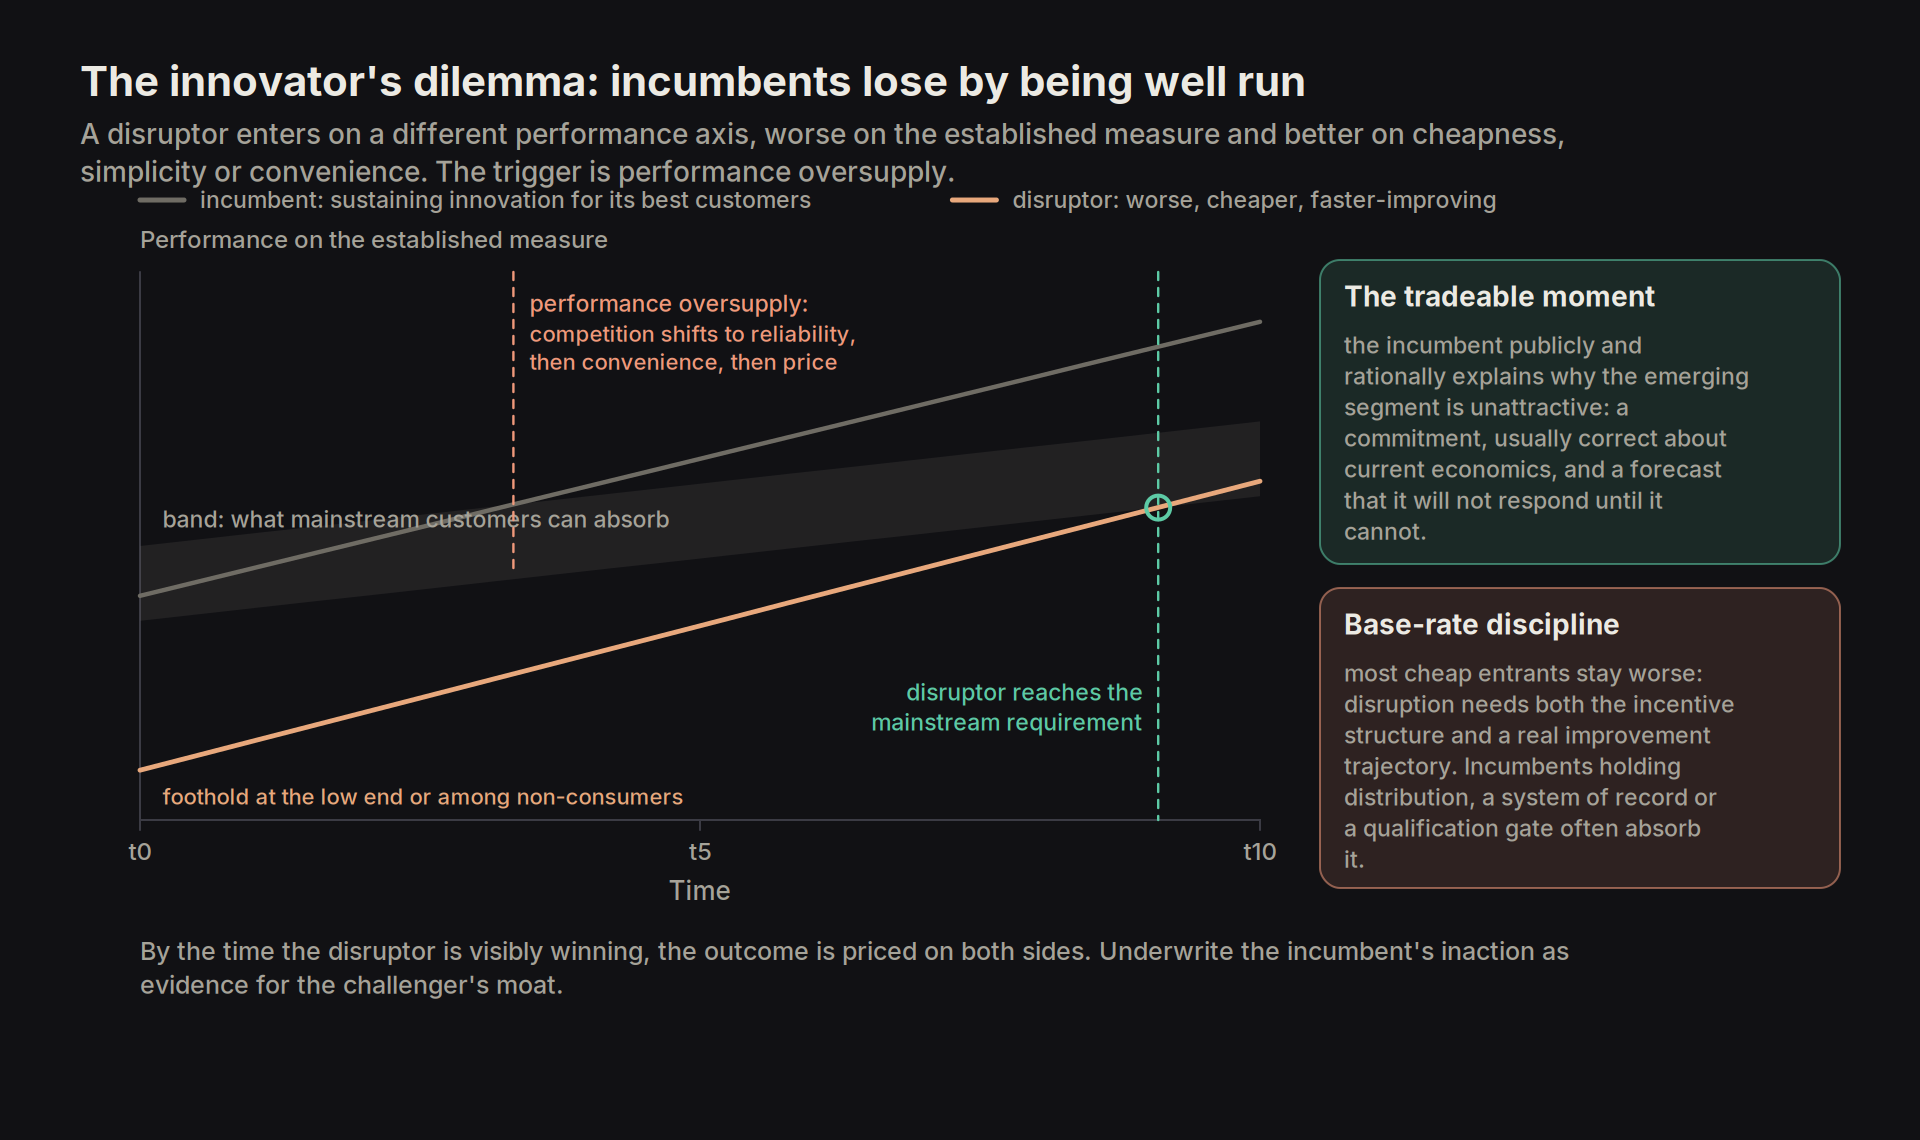
The second is the innovator's dilemma, the mechanism by which well-run incumbents lose to entrants offering an initially inferior product. A challenger adopts a business model that the incumbent sees perfectly clearly and rationally declines to copy, because responding would damage the existing business and runs against management's short-term incentives, so incumbents lose by being well run: they listen to their most important customers, they allocate capital to the highest-margin opportunities available, and they apply the disciplined screening processes that built their position, and each of those correct behaviours starves the low-margin, small-market, initially worse product that eventually takes the industry. A sustaining innovation improves the product along the dimension mainstream customers already value, and the incumbent almost always wins it, because it has more resources and more reason to fight; a disruptive innovation enters on a different performance axis, worse on the established measure and better on cheapness, simplicity, convenience or accessibility, and takes root at the low end of the market that the incumbent is happy to give up, or among customers who were not buying anything at all. The trigger that converts the foothold into a takeover is performance oversupply: once the incumbent's improvement outruns what mainstream customers can absorb, the basis of competition shifts from functionality to reliability, then to convenience, then to price, and the disruptor's own improvement, running from a worse but faster-improving base, reaches the mainstream requirement while the incumbent is still optimising a dimension the customer has stopped paying for.
The incumbent's inaction should be underwritten as evidence for the challenger's moat, because a competitive response that would destroy the responder's own economics will not arrive on any timetable short of an existential one, and the tradeable moment is earlier than most practitioners think: by the time the disruptor is visibly winning, the outcome is priced on both sides, whereas the informative datapoint is the incumbent publicly and rationally explaining why the emerging segment is unattractive, because that explanation is a commitment, it is usually correct about current economics, and it is effectively a forecast that the incumbent will not respond until responding is no longer possible.
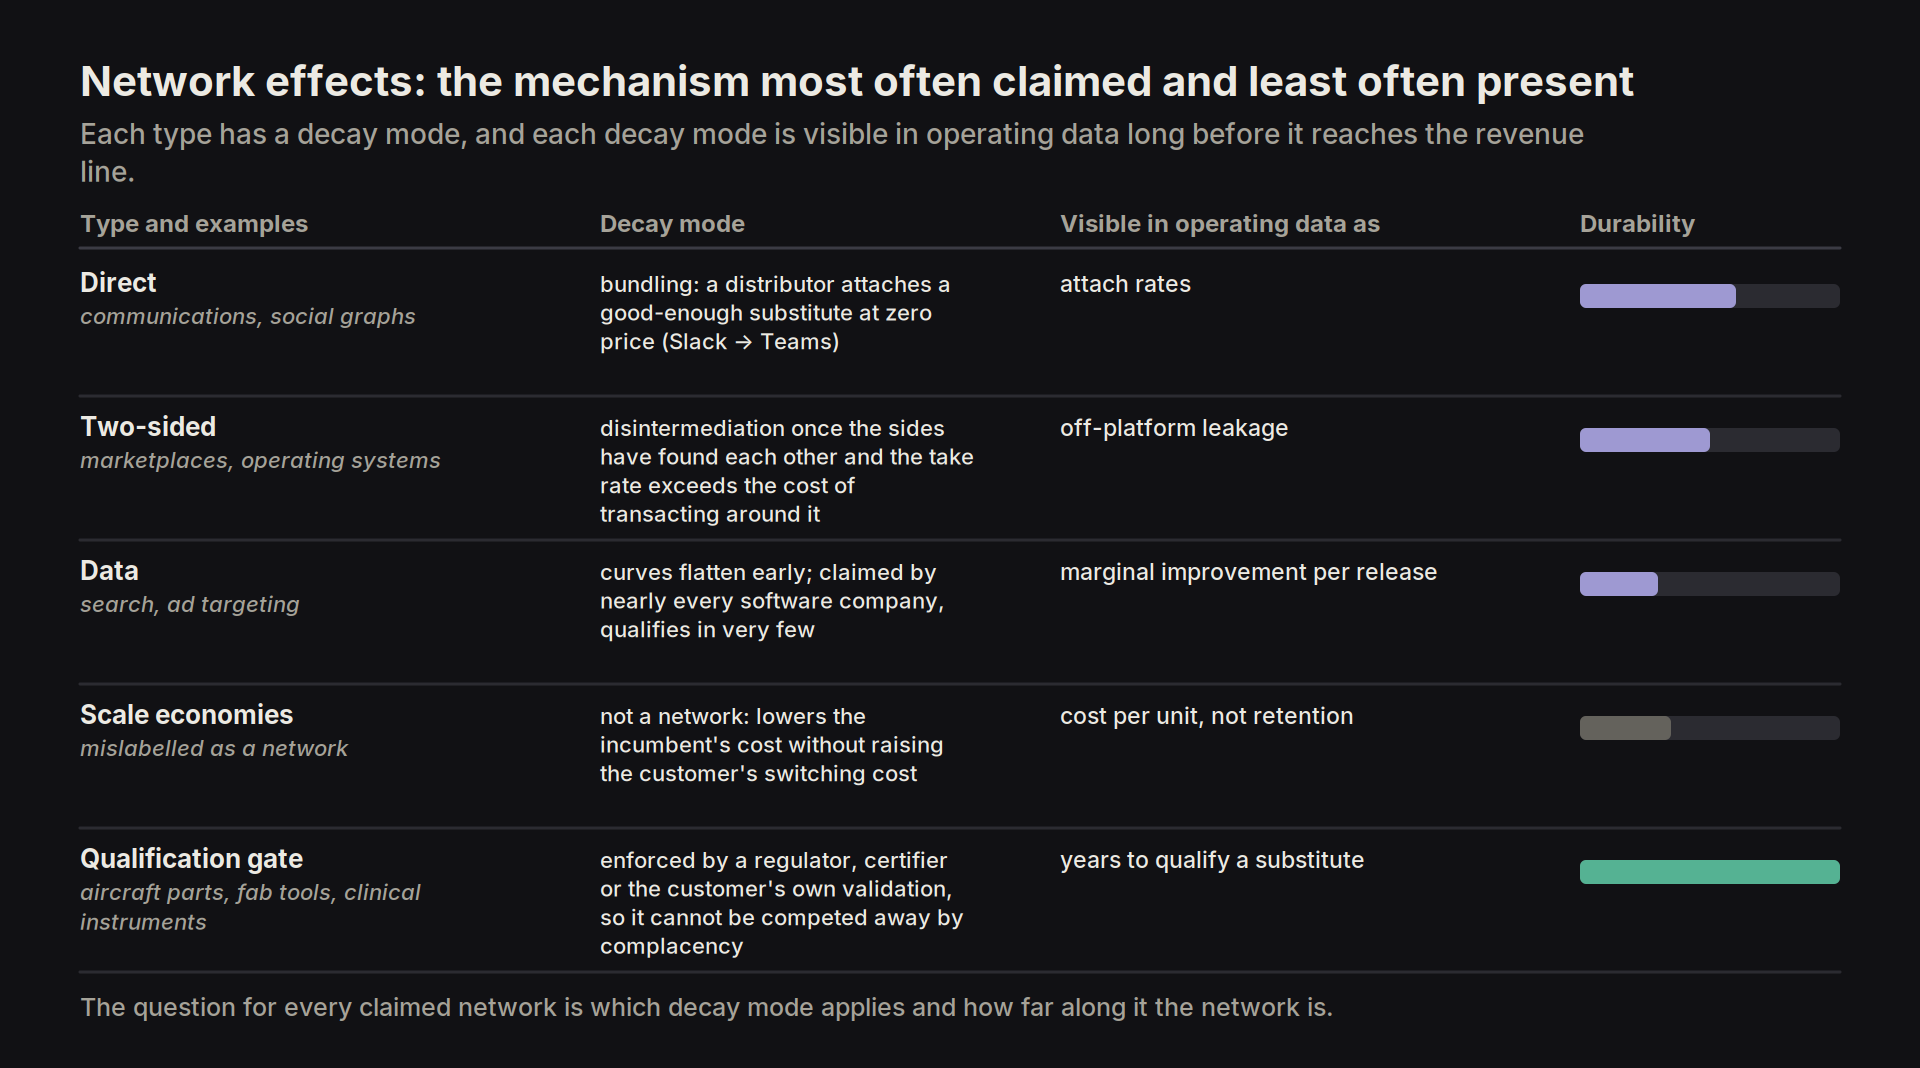
The third is the network effect, which is the mechanism most often claimed and least often present. These can include:
- Direct effects, where each user makes the network more valuable to every other user (communications, social graphs), are the strongest while they hold and decay through bundling, since a distributor that already owns the customer relationship can attach a good-enough substitute at zero marginal price (Slack to Teams).
- Two-sided or indirect effects, where more buyers attract more sellers (marketplaces, operating systems), decay through disintermediation once the two sides have found each other and the platform's take rate exceeds the cost of transacting around it (Airbnb's host-loyalty problem).
- Data effects, where utility genuinely rises with the scale of data (search, ad targeting), are claimed by nearly every software company and qualify in very few, because the test is that the marginal datapoint still improves the product at the current scale and most such curves flatten early. Scale economies are routinely mislabelled as networks and are a different thing, since they lower the incumbent's cost without raising the customer's switching cost.
- The most durable form is the qualification-gate monopoly, where a regulator, a certification body or a customer's own validation process makes switching a multi-year project regardless of price (aircraft components, process tools qualified into a semiconductor fab, clinical-grade instruments), because the gate is enforced by someone other than the incumbent and so cannot be competed away by the incumbent's own complacency.
The question for every claimed network is which decay mode applies and how far along it the network is, since each mode is visible in operating data (bundling in attach rates, disintermediation in off-platform leakage, flattening data effects in the marginal improvement per release) long before it reaches the revenue line.
Three further concepts that typically confer a moat:
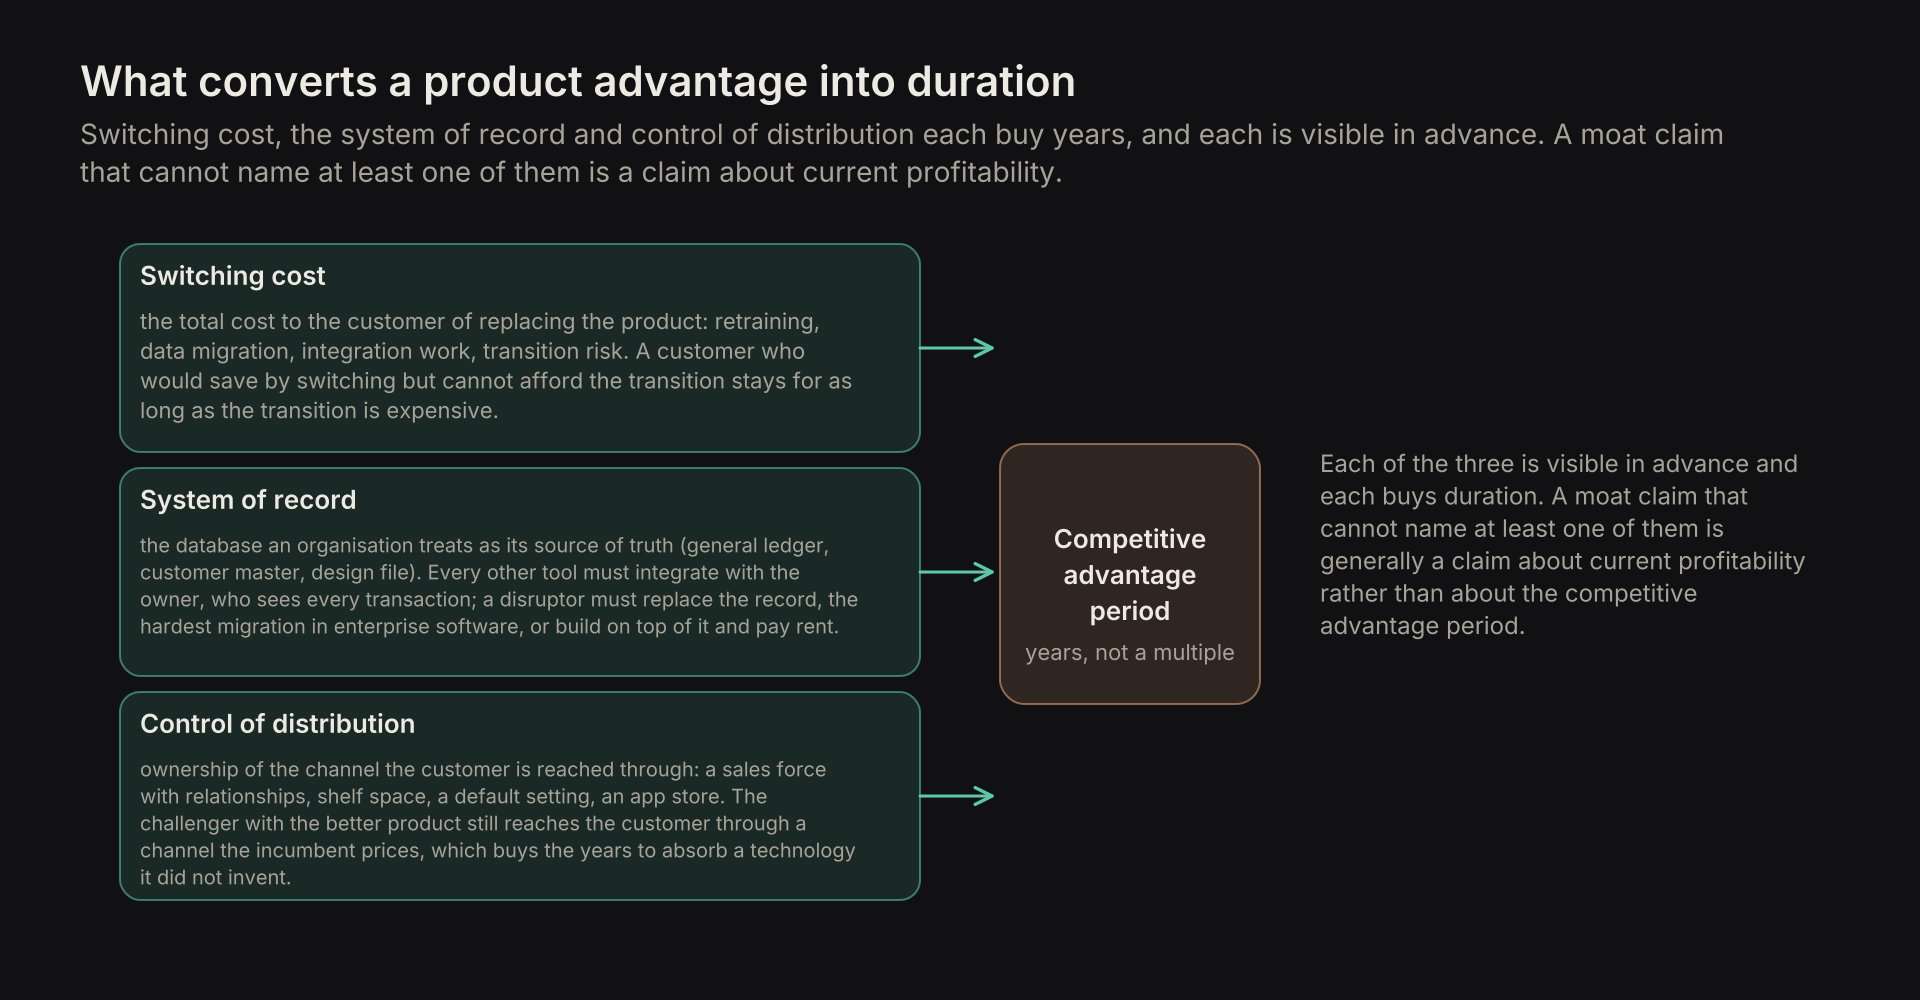
- Switching cost is the total cost to the customer of replacing the product, including retraining, data migration, integration work and the risk of the transition, and it is the variable that converts a product advantage into a duration, since a customer who would save money by switching but cannot afford the transition is a customer for as long as the transition stays expensive.
- A system of record is the database an organisation treats as its authoritative source of truth (the general ledger, the customer master, the design file), and owning it means every other tool in the workflow must integrate with the owner and the owner sees every transaction; it is the position from which incumbents most often absorb disruption, because the disruptor must either replace the record, which is the hardest migration in enterprise software, or build on top of it and pay rent.
- Control of distribution is the ownership of the channel through which the customer is reached, whether a sales force with existing relationships, shelf space, a default setting or an app store, and it is what allows an incumbent to buy the years it needs to absorb a technology it did not invent, since the challenger with the better product still has to reach the customer through a channel the incumbent prices.
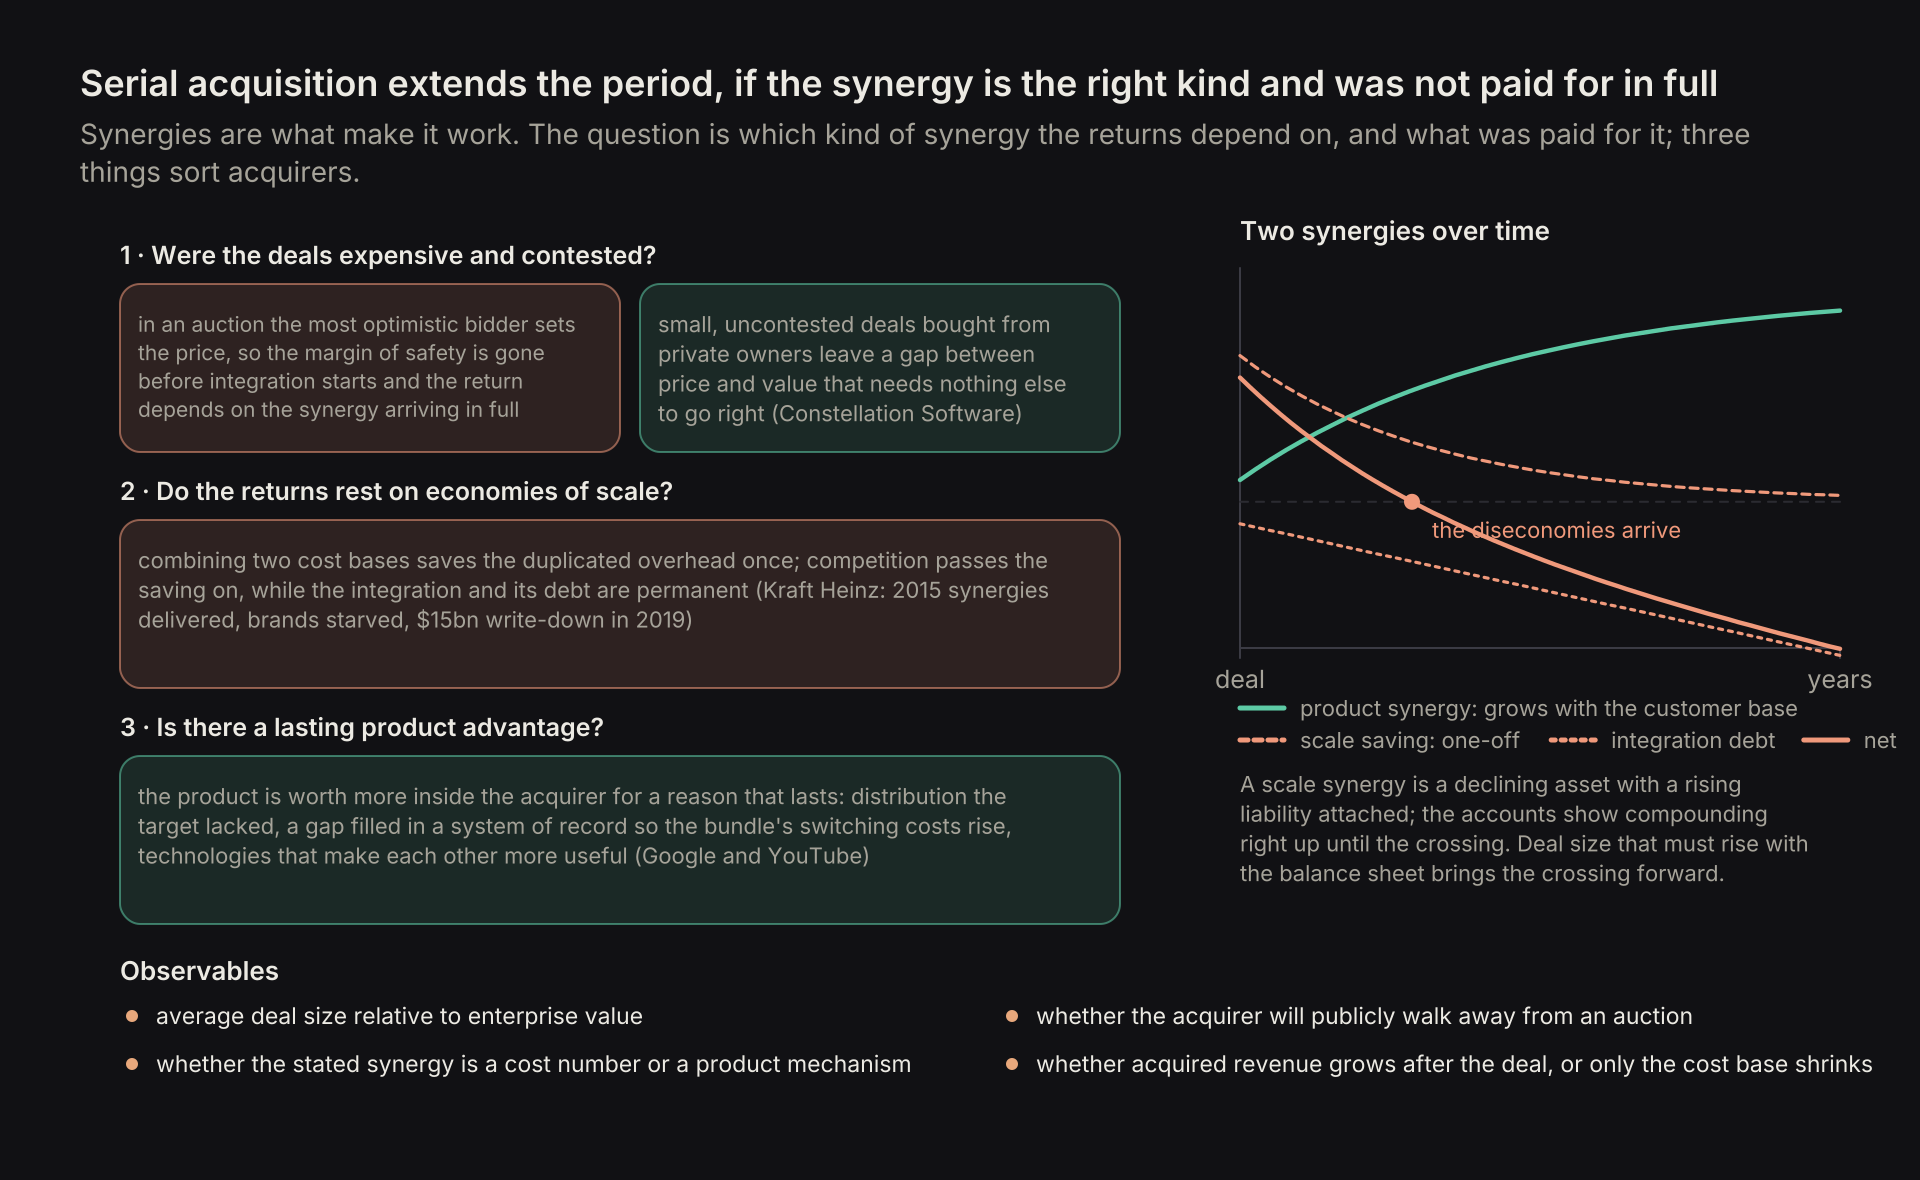
Serial acquisition is also a way to extend a competitive advantage period, and synergies are what make it work. The question is which kind of synergy the returns depend on, and what was paid for it. Three things sort acquirers.
- Whether the deals are expensive and contested. In a competitive auction the price is set by the most optimistic bidder, so the margin of safety is gone before integration starts, and the return then depends entirely on the synergy arriving in full. Small, uncontested deals bought from private owners leave a gap between price and value that needs nothing else to go right. Constellation Software is the model: many small deals, disciplined prices, decentralised operations, and a genuine cost-of-capital advantage.
- Whether the returns rest on economies of scale. Combining two cost bases removes duplicated overhead once. That saving is one-off, and competition passes it to customers over time. The integration that produced it is permanent. The acquired business now needs the acquirer's rules, processes and management layers to stay coordinated, and it brings integration debt: incompatible systems, conflicting definitions, and a culture that has to be re-taught. So a scale synergy is a declining asset with a rising liability attached, and the accounts show compounding right up until the diseconomies arrive. Models that also need deal size to keep rising with the balance sheet make this worse, because each larger deal adds more integration than the last. Kraft Heinz is the case. The 2015 cost synergies were delivered, the brands were starved of the investment needed to stay relevant, and the fifteen-billion-dollar write-down came in 2019.
- Whether there is a genuine, long-term product advantage. The acquired product is worth more inside the acquirer for a reason that lasts. The acquirer's distribution reaches customers the target could not, or the product fills a gap in a system of record or a platform so the bundle's switching costs rise, or the two technologies make each other more useful to the customer. This synergy grows with the customer base instead of dissipating, and it lengthens the competitive advantage period rather than borrowing from it. Google's purchase of YouTube is the clearest case: the product was worth more on Google's distribution and advertising system than it could have been on its own.
The observables are the average deal size relative to enterprise value, whether the acquirer will publicly walk away from an auction, whether the stated synergy is a cost number or a product mechanism, and whether the acquired revenue grows after the deal or only the cost base shrinks.
3.5 Generating variant perception and non-consensus insights
The centre of research into each opportunity is the set of key non-consensus insights, generated through rigorous groundwork, unique perspectives on the industry and the identification of biases inherent in the market, and paired with a timed catalyst.
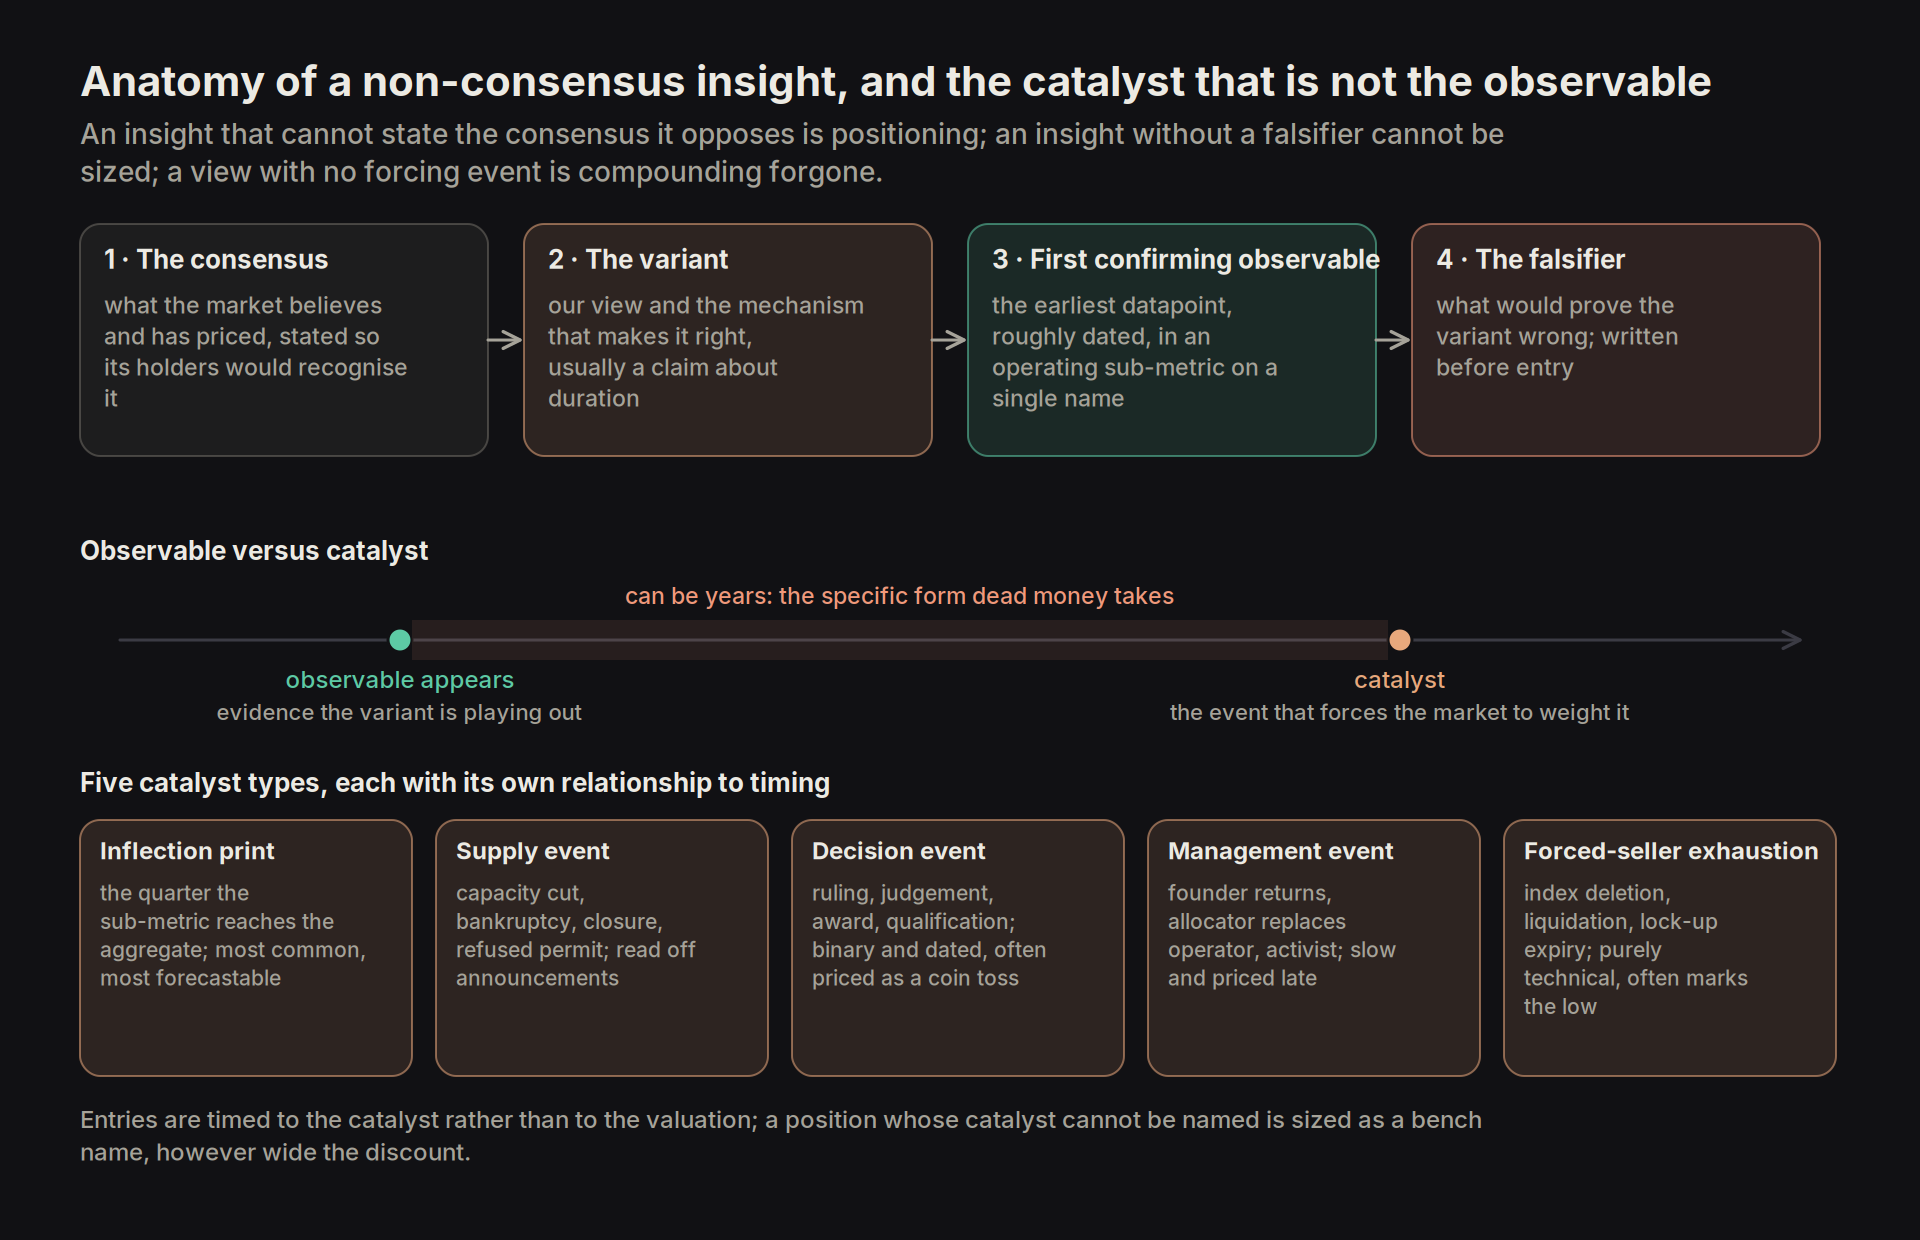
Each non-consensus insight should have four parts:
- First, the consensus: what the market currently believes and has priced, stated fairly enough that a holder of the consensus view would recognise it.
- Second, the variant: the view we hold instead, with the mechanism that makes it right, which for a moat claim is generally a statement about duration, that the competitive advantage period is longer or shorter than the price implies and why.
- Third, the first confirming observable: the earliest datapoint, with a rough date, that would show the variant playing out, an operating sub-metric read on a single name rather than a reported aggregate.
- Fourth, the falsifier: what would prove the variant wrong. An insight that cannot state the consensus it opposes is positioning rather than analysis, and an insight without a falsifier cannot be sized.
The catalyst is distinct from the first confirming observable, and the two are routinely confused. The observable is evidence that the variant is playing out, read in an operating sub-metric that the market does not yet weight; the catalyst is the event that forces the market to weight it, and a thesis can have the first without the second for years, which is the specific form dead money takes in a contemporary value-factor investor's book.
Examples of catalysts:
- The inflection print, the first reported quarter in which the sub-metric reaches the aggregate (a capacity cut showing up in pricing, a retention improvement showing up in growth), is the most common and the most forecastable, since the lag between sub-metric and aggregate is roughly known.
- The supply event, a capacity cut, a bankruptcy, a plant closure or a regulator refusing a permit, is the industry capital cycle's own catalyst, and is read off announcements rather than results.
- The decision event, a regulatory ruling, a court judgement, a contract award or a qualification, is binary, dated and generally priced as a coin toss when the work says it is not.
- The management event, a founder returning, a capital allocator replacing an operator, or an activist arriving, changes the pipeline of future options rather than the existing business and is priced late because its effects are slow.
- The exhaustion of the forced seller, the end of an index deletion, a fund liquidation or a lock-up expiry, is the only catalyst that is purely technical, and it is the one that most often coincides with the low.
Position sizing is timed to the catalyst as well as the valuation, and a position whose catalyst cannot be named is sized as a bench name rather than a core one, however wide the discount, because the cost of a correct view with no forcing event is the compounding forgone while the market takes its time.
3.6 Assessing management and culture
A company is an existing business plus a pipeline of options; management and culture quality is the determinant of whether that pipeline is converted into new businesses at positive net present value, and since the market generally prices the pipeline at zero or below, assessing management and culture is an estimate of growth duration that the traditional DCF cannot make.
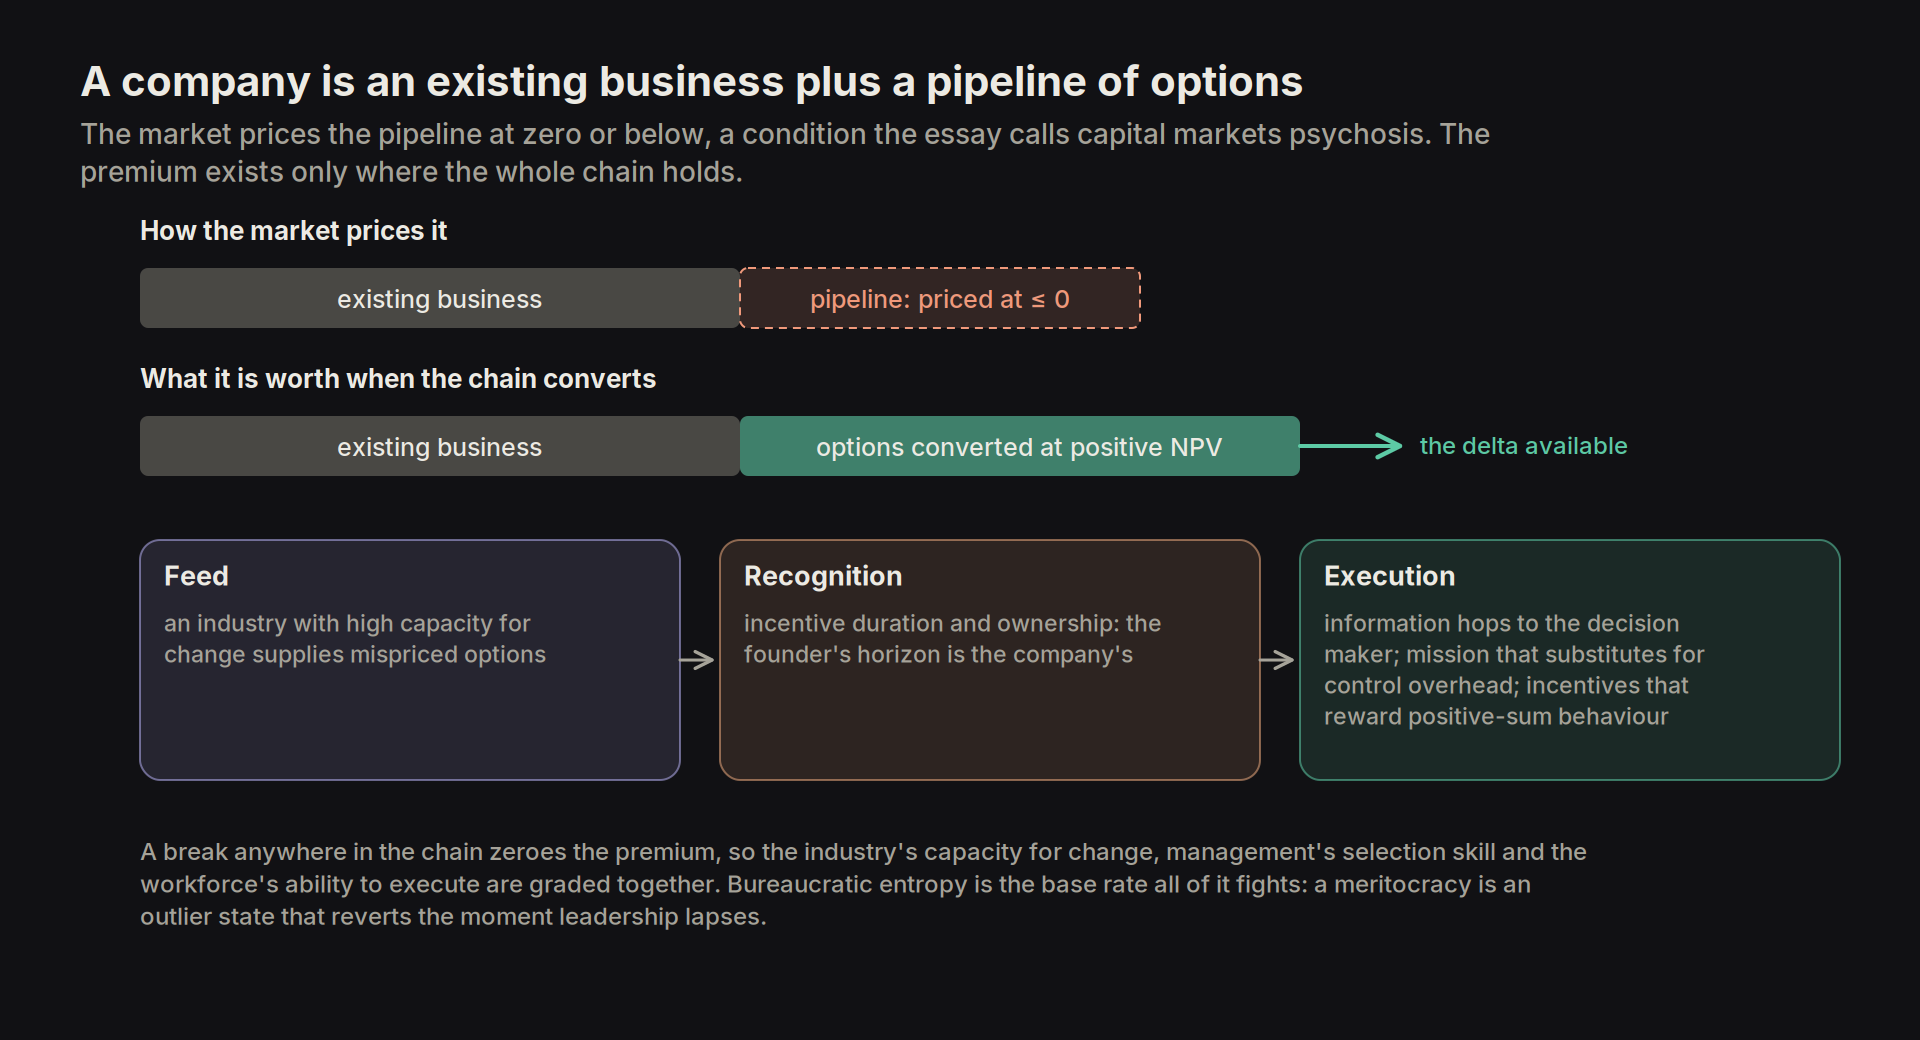
For a pipeline to exist, it has to be recognised. Recognition is mostly incentive duration and ownership: founder-controlled companies tend to do better because the founder's horizon is the company's, whereas executives on short-term compensation maximise the share price through market messaging, poorly priced buybacks and benchmarking strategy against peer consensus rather than first principles.
Recognised options require execution, which is a matter of three variables:
- Information flow: the number of hops a piece of critical customer or operational information takes before reaching a decision maker is a direct gauge of adaptability, and a stale organisation's executives see product problems years late in a dashboard of declining growth, while in the best organisations employees message senior leaders directly.
- Corporate mission and purpose: a mission tied to a unique product for an economy in flux, rather than generic values language, lets incentive alignment substitute for control overhead, and such firms learn fast and attract high-calibre staff at below-market pay, since those staff feel paid in learning and experience, which lets the firm attack low-margin opportunities incumbents cannot.
- Incentive design and meritocracy: management must reward positive-sum behaviour for the team and the broader business and guard against the tendency for businesses to become fiefdoms and to reward status-seeking behaviour, both of which are forms of bureaucratic entropy, and the entropy is the base rate: firms accumulate staff who work for status and compete with colleagues for a share of a fixed pool, so a meritocratic culture is an outlier state that takes exemplary leadership to hold and reverts the moment that leadership lapses.
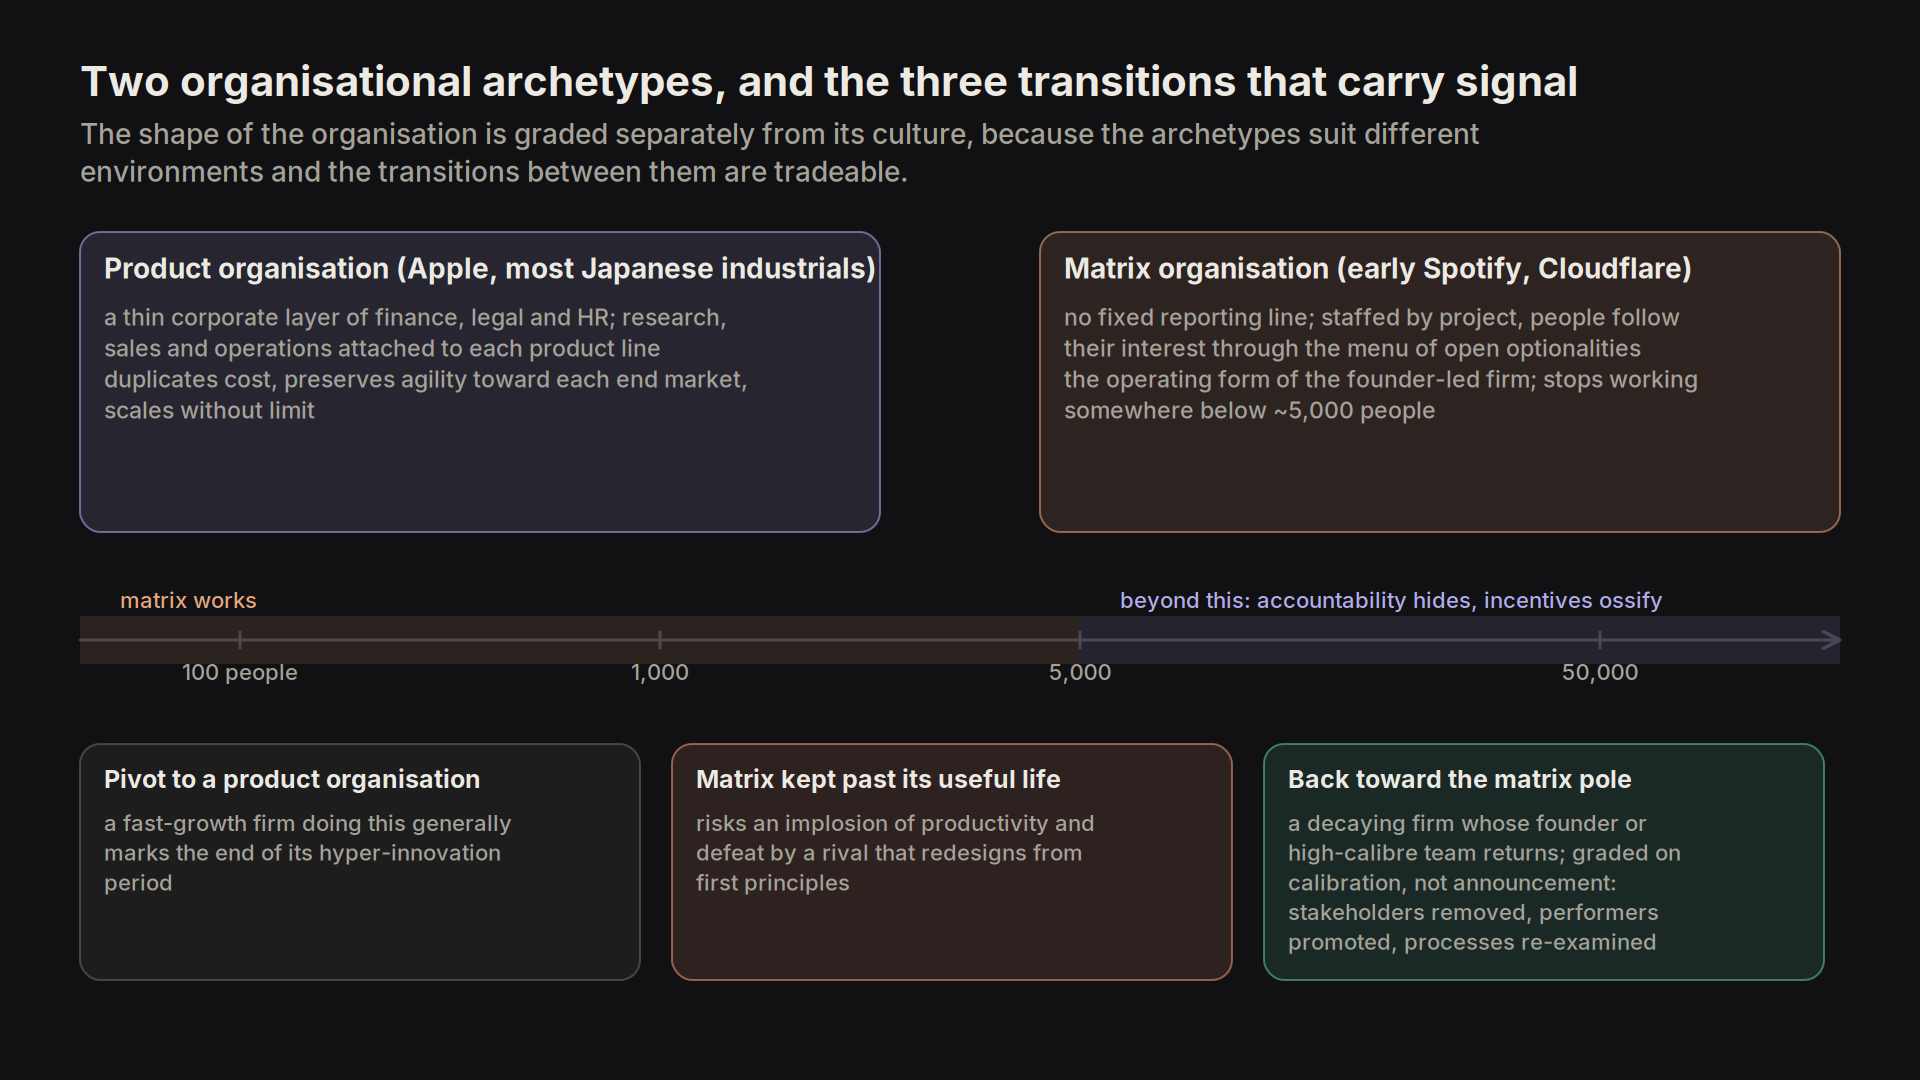
The shape of the organisation is graded separately from its culture, because the two archetypes suit different environments and the transitions between them are tradeable.
- A product organisation (Apple, most Japanese industrials) keeps a thin corporate layer of finance, legal and human resources and attaches everything else, including research, sales and operations, to each product line, which duplicates cost but preserves agility toward each end market and scales without limit.
- A matrix organisation (early Spotify, Cloudflare) has no fixed reporting line, staffs by project, reassigns people at the end of each and lets them follow their interest through the 'menu' of open optionalities, which is the operating form of the founder-led firm with start-up energy and is the structure most 'optionality-capturing' fast-growth companies actually run, but it stops working somewhere below five thousand people, where individual accountability becomes easy to hide and the overhead of incentives forces roles and processes to ossify.
Three transitions carry signal: a fast-growth firm pivoting to a product organisation generally marks the end of its hyper-innovation period, since the management overhead has outgrown the agility; a firm that keeps the matrix past its useful life risks an implosion of productivity and defeat by a more mature rival that redesigns its structure from first principles; and a decaying firm whose founder or a high-calibre team returns generally moves back toward the matrix pole, and the calibration of that move, whether the blocking stakeholders are actually removed, the high-performing subordinates actually promoted and the processes actually re-examined, is what separates the turnarounds that work from the announcements, which is the standard private-equity playbook run in public.
3.7 Reading the cycles
Paying the right price and timing capital deployment intelligently are the two levers the value investing discipline ultimately reduces to in practice, and three cycles operate on any position at the same time; most misdiagnosed mean reversion comes from confusing them.
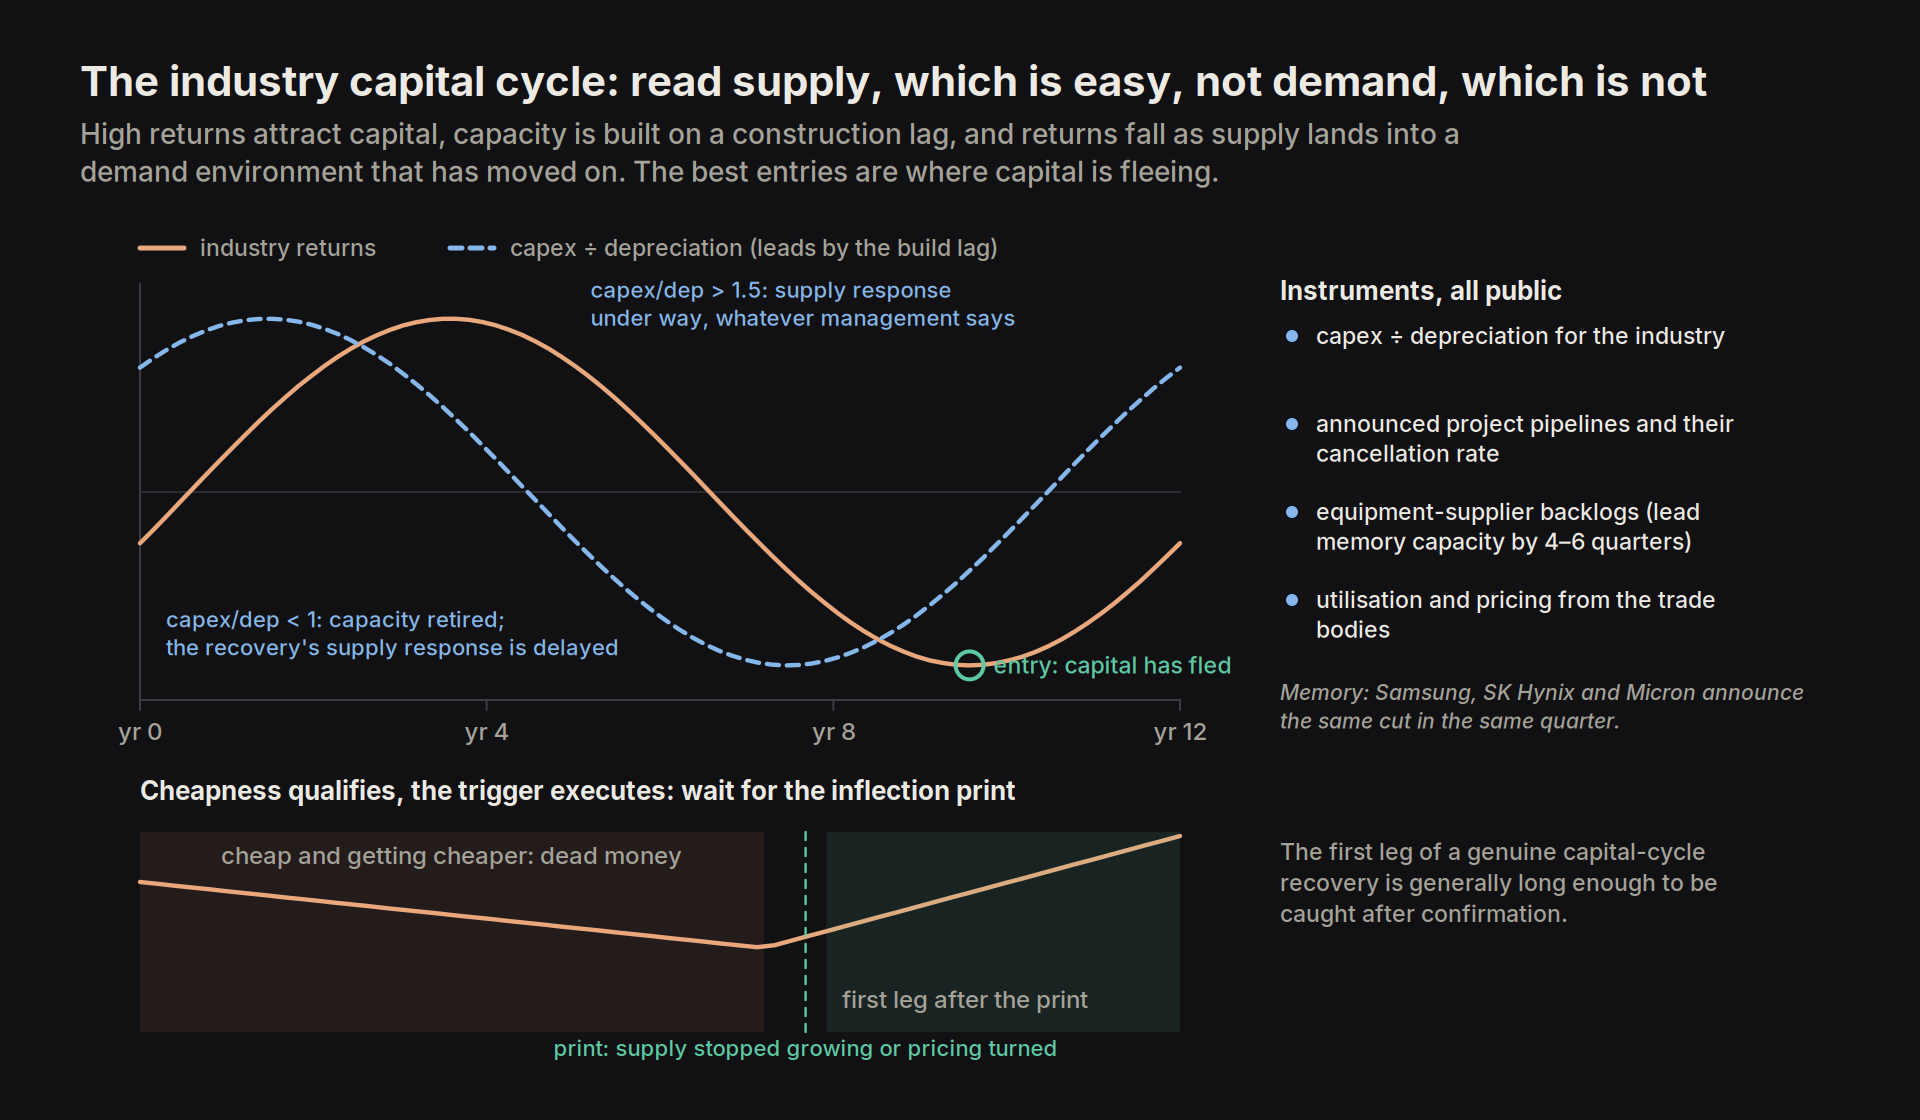
- The first is the industry capital cycle. High returns attract capital, capital builds capacity, capacity arrives with a lag set by construction time, and returns fall as the new supply lands, usually into the demand environment that justified the investment three years earlier. The inversion is that the best entries are where capital is fleeing, because the same lag runs in reverse: capacity is retired, projects are cancelled, and the supply response to the eventual recovery is delayed by the period during which nobody was willing to fund it. Investors over-research demand, which is difficult to forecast, and under-research supply, which is comparatively easy to read from capex-to-depreciation ratios, announced project pipelines and industry capacity data. The memory industry is the textbook case, with each of Samsung, SK Hynix and Micron announcing the same cut in the same quarter, so the cycle can usually be read off capital flight. The instruments are the ratio of capital expenditure to depreciation for the industry (above about one and a half the supply response is under way whatever management says about discipline; below one, capacity is being retired), announced project pipelines and their cancellation rate, order backlogs at the equipment suppliers (the semiconductor equipment makers' books lead memory capacity by four to six quarters), and utilisation and pricing data from the industry's own trade bodies, all of which are public and none of which are weighted by an analyst community that spends its time on demand.
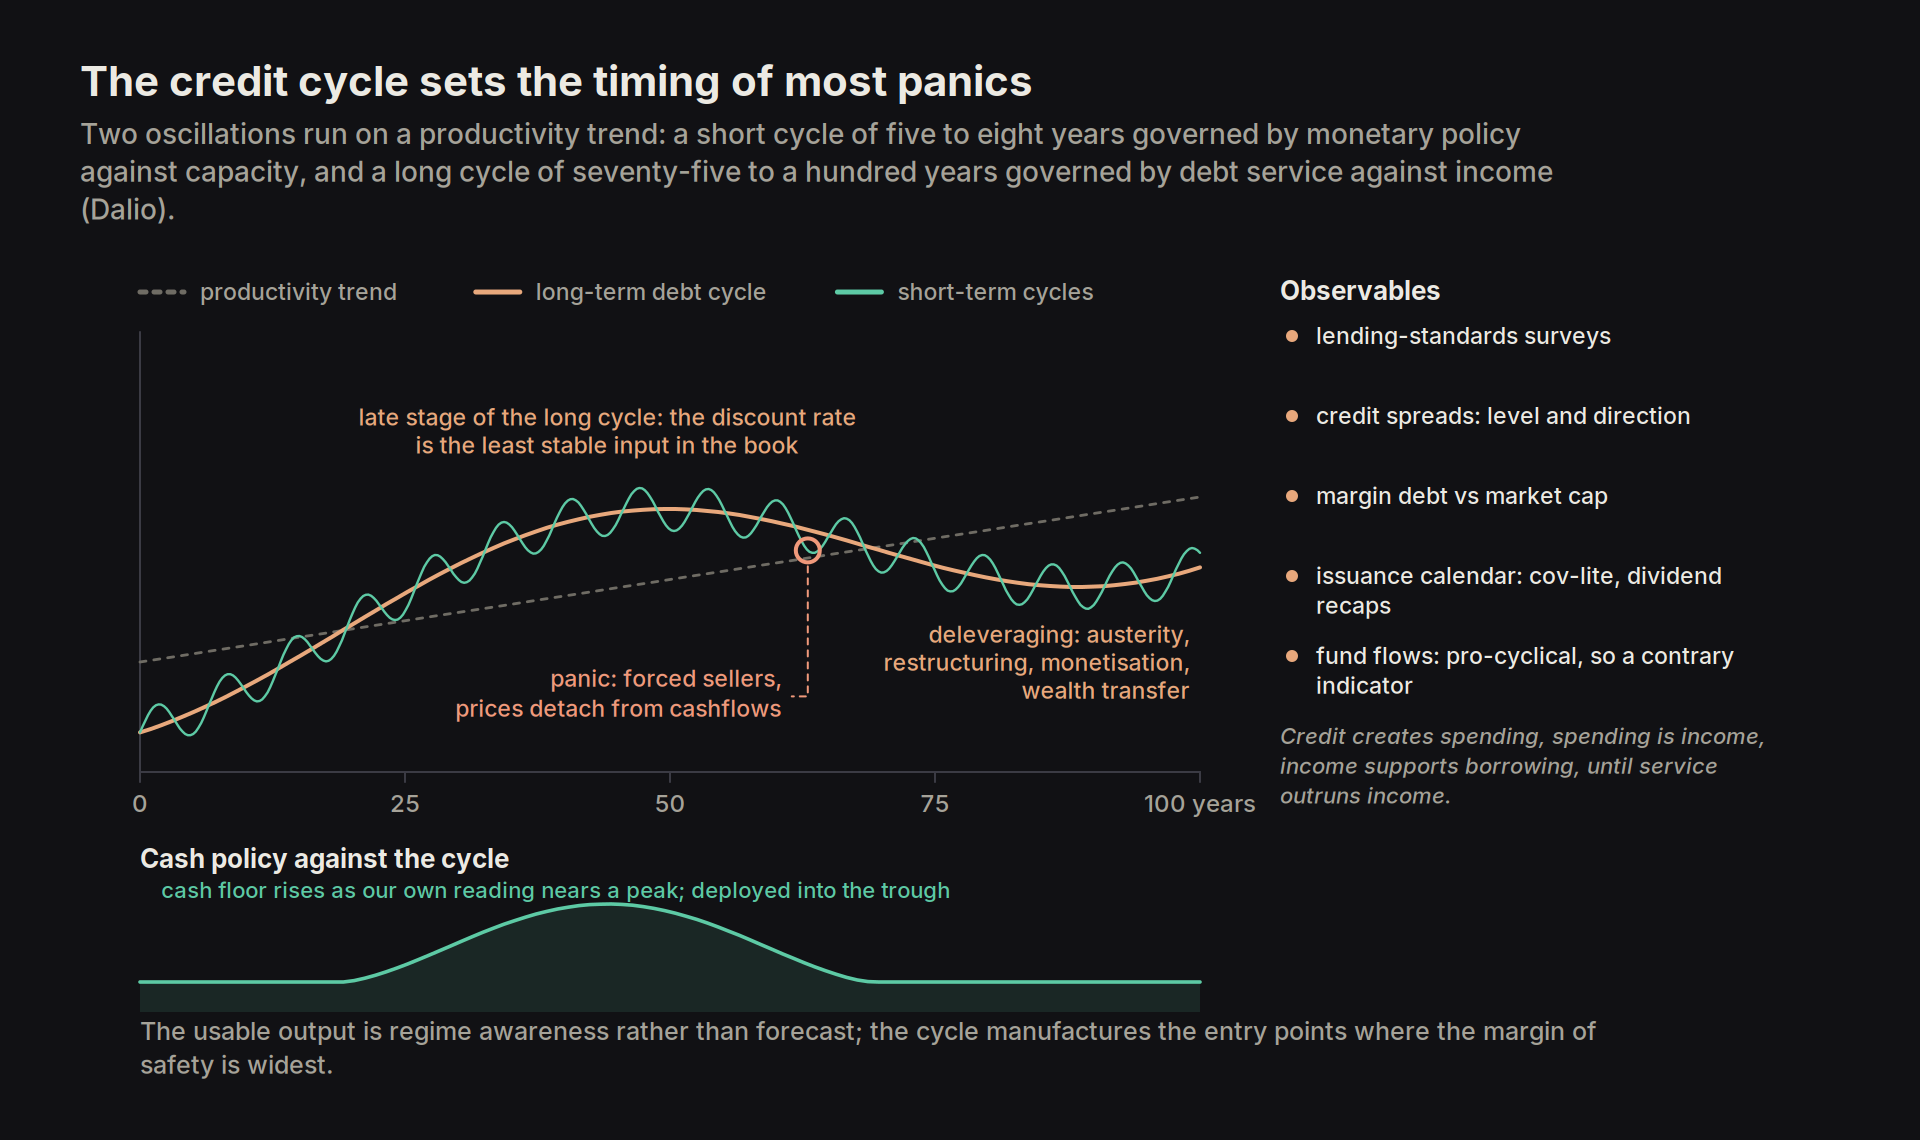
- The second is the macroeconomic credit cycle, which sets the timing of most market panics, so that an assessment of it is what allows the value investor to buy low and sell high rather than merely to buy cheap. Credit creates spending, spending is by definition someone else's income, and income supports further borrowing, so an expansion feeds itself for as long as the cost of servicing the accumulated debt grows more slowly than the income available to service it; when that reverses, borrowers cut spending to service debt, the cut becomes someone else's lost income, and the collateral that was lent against falls in price, which tightens lending further. Two oscillations run on top of the productivity trend: a short-term cycle of five to eight years governed by monetary policy against capacity, and a long-term cycle of seventy-five to a hundred years governed by total debt service against income, whose deleveraging phase is resolved by some mix of austerity, restructuring, monetisation and wealth transfer, and whether nominal growth stays above nominal rates through that mix is what decides whether the deleveraging is orderly. The usable output is regime awareness rather than forecast: in the late stage of the long cycle the discount rate is the least stable input in every valuation in the book, and the observables are the lending-standards surveys, the level and direction of credit spreads, margin debt against market capitalisation, the issuance calendar (covenant-lite volume and the share of proceeds going to dividends rather than investment) and fund flows, which run pro-cyclically, rising with trailing performance and falling with trailing drawdown, and are thus a contrary indicator by construction. The contraction is as self-reinforcing as the expansion, and its acute phase is a panic: holders who borrowed against their assets, or who face redemptions, are forced to sell regardless of value, and prices detach from cashflows in the direction the value investor wants. The cycle manufactures the entry points where the margin of safety is widest, and the cash accumulated near the peak is most valuable, when forced sellers dominate the tape.
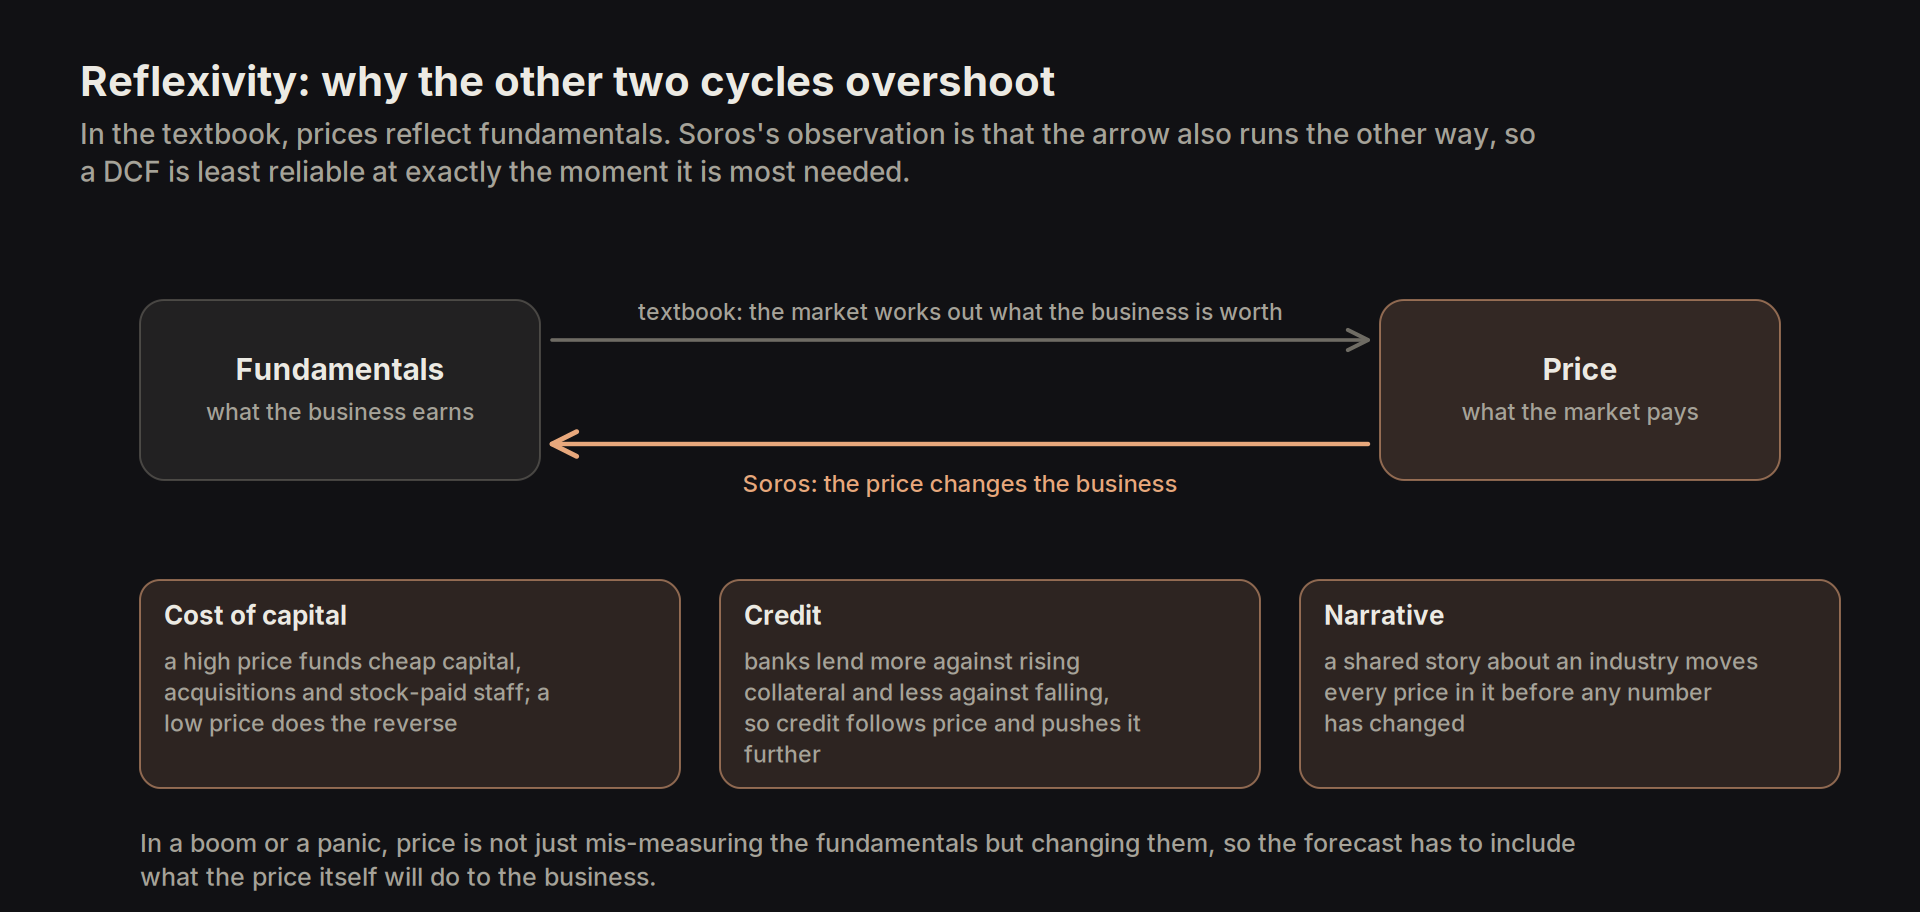
- The third is reflexivity. In the textbook, prices reflect fundamentals: the business earns what it earns, and the market works out what that is worth. Soros's observation is that the arrow also runs the other way. A high share price lets a company raise cheap capital, buy competitors and pay staff in stock, so the price improves the business; a low share price does the opposite. The clearest case is talent. Stock-based pay is worth what the share price says it is worth. When the price is depressed, the best employees, who are the ones with offers elsewhere, are the first to leave, and the market's verdict reads from the outside as a failing company, so the firm cannot hire replacements of the same quality. The price therefore degrades the business through its people before it shows up in the numbers, and the reverse holds in a boom, when a rising price recruits for free. Banks lend more against assets whose prices are rising and less against assets whose prices are falling, so credit follows price and then pushes it further. And because most participants take their cues from a shared story about an industry, a change in the story can move every price in it before any number has changed. The consequence for us is that a discounted cashflow is least reliable at exactly the moment it is most needed. In a boom or a panic, price is not just mis-measuring the fundamentals but changing them, so the forecast has to include what the price itself will do to the business.
Style and sector rotations are the visible surface of all three. Capital floods the phase with the freshest returns and flees the oldest, so a rotation is effectively the capital cycle observed at the level of the allocator. Awareness of the process, and positioning ahead of the consensus migration, adds to returns independently of any single-name work, and is one of the few additive overlays available to a bottom-up book.
Cheapness qualifies an opportunity and the trigger executes it, so industries exiting multi-year bear markets are the richest hunting ground in the whole framework, and the correct discipline is nonetheless to wait for the inflection print, the first datapoint showing that supply has actually stopped growing or that pricing has actually turned, instead of averaging into the cheap-and-getting-cheaper phase on valuation alone. This is the specific fix for deep value's dead-money problem, and it costs less than it appears to: the first leg of a genuine capital-cycle recovery is generally long enough to be caught after confirmation, while the pre-confirmation phase can absorb years of capital that has better uses.
Part Four — Superforecasting: probabilistic valuation and portfolio construction
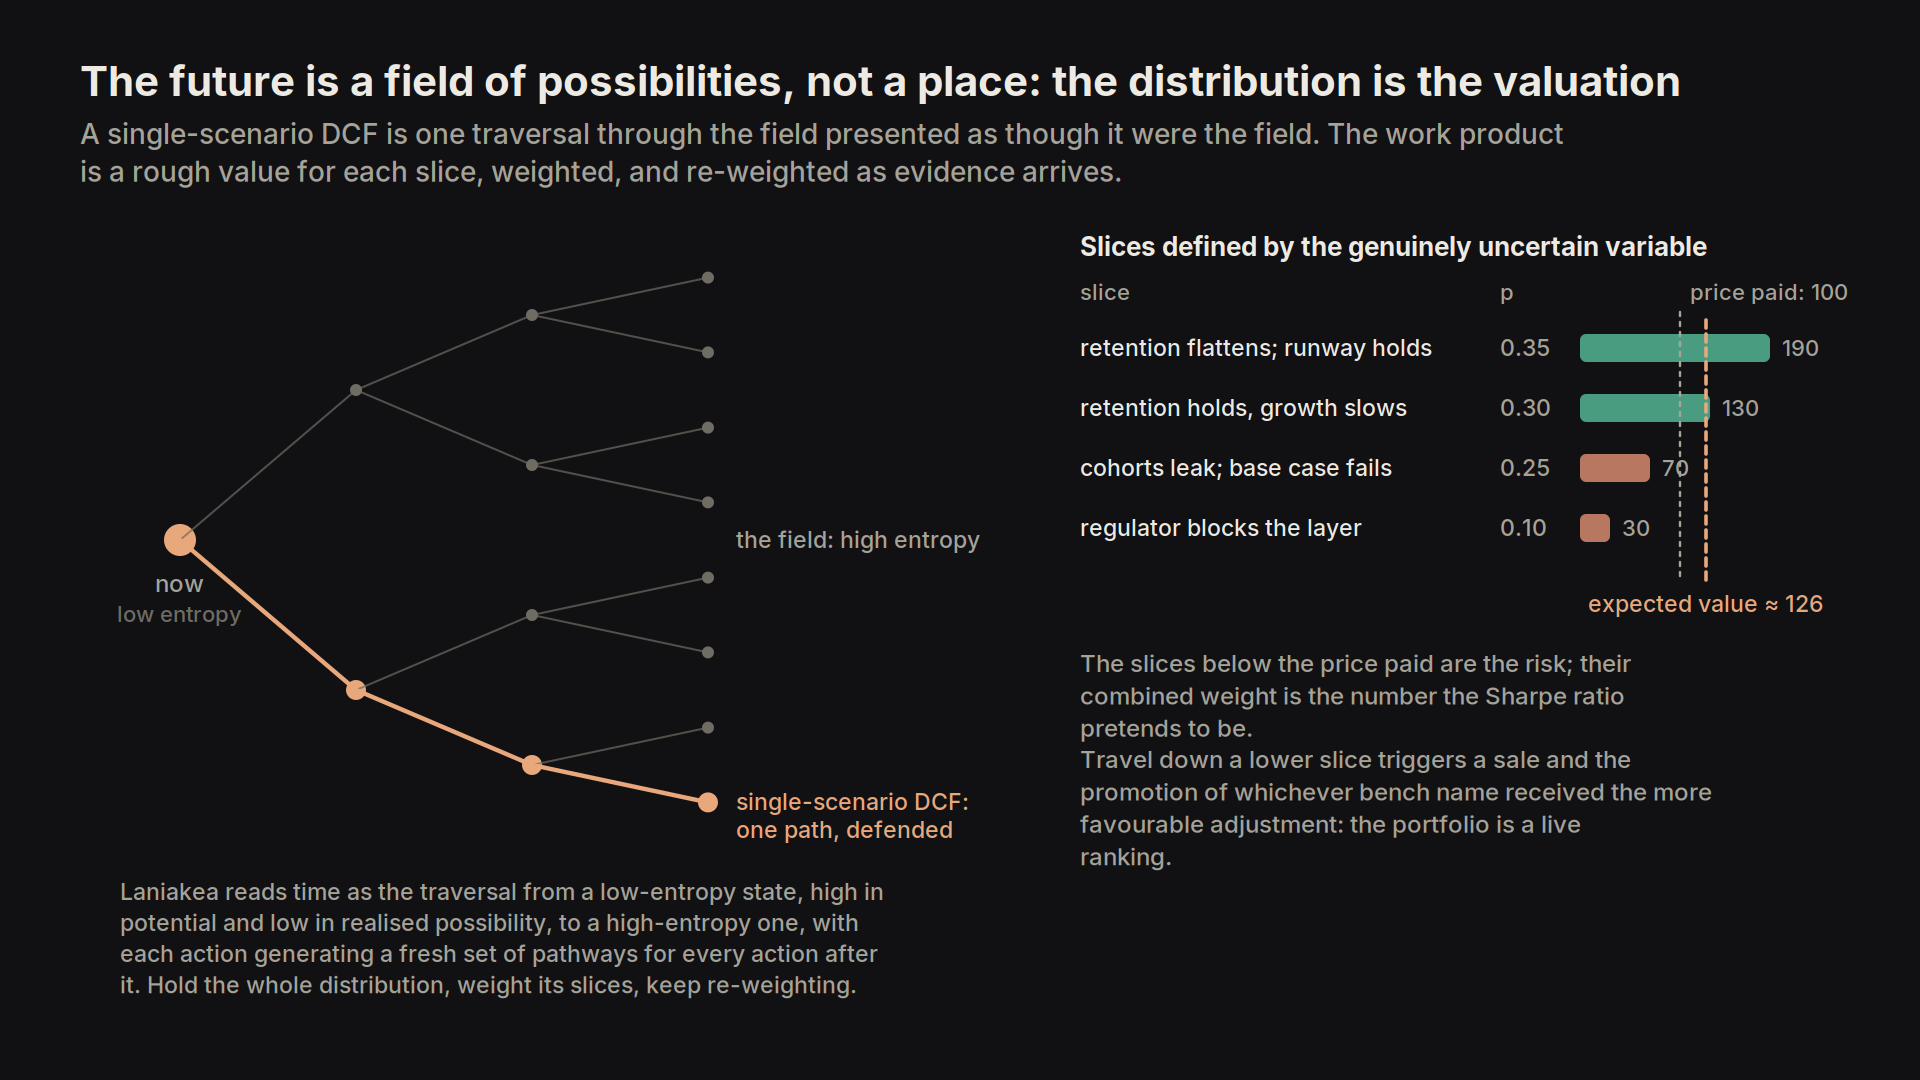
Laniakea Partners subscribes to the Everett (many-worlds) interpretation of quantum mechanics and applies it to investing; we see time as the traversal from a low-entropy state (high in potential and low in realised possibility) to a high-entropy one (low in potential and high in realised possibility), with each action along the way generating a fresh set of pathways for every action after it.
The future is thus a field of possibilities and not a static place. To forecast the future accurately, we hold the whole distribution of outcomes, weight its slices, and keep re-weighting as evidence arrives, instead of producing a point estimate and defending it.
The industry's central artefact, the single-scenario discounted cashflow, is one traversal through that field presented as though it were the field, and most valuation error in professional practice descends from that substitution.
4.1 Probability-weighted forecasting
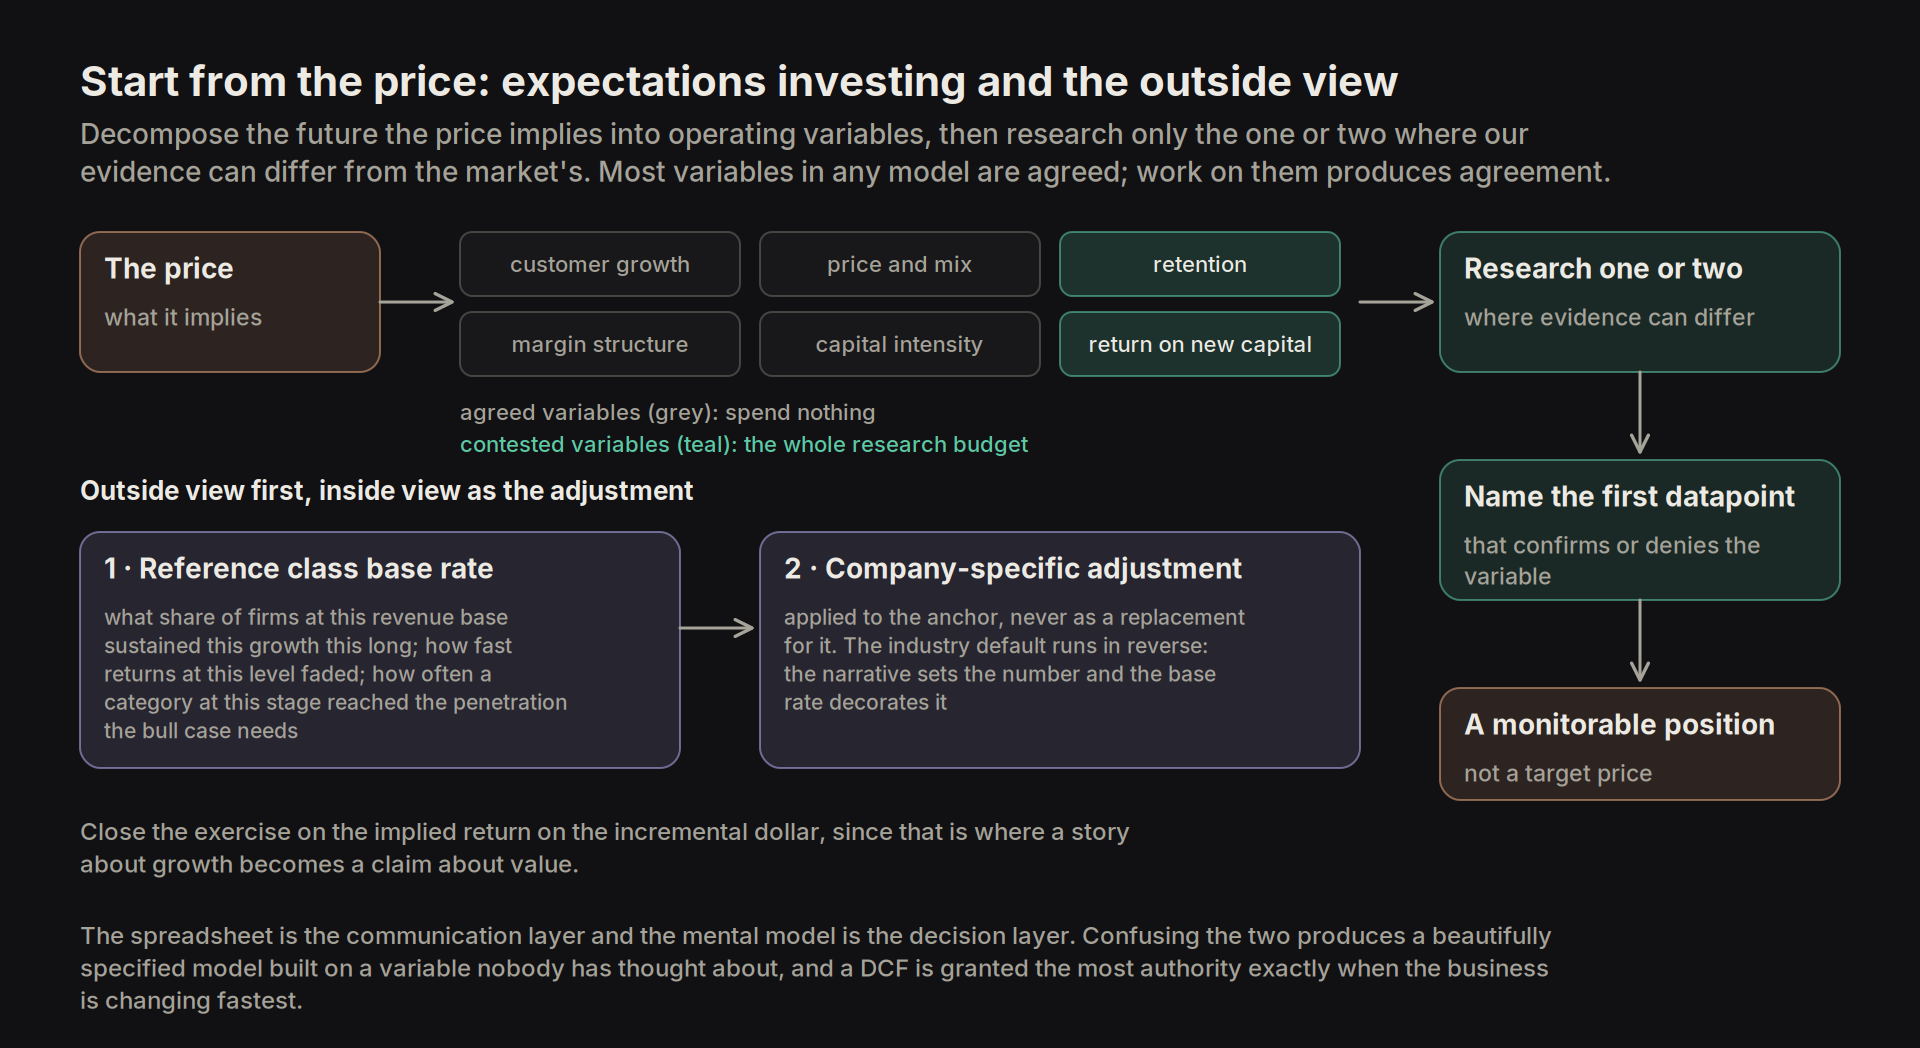
Start from the price, which is the discipline Rappaport and Mauboussin formalised as expectations investing. Decompose the future that the price implies into operating variables, meaning customer growth, price and mix, retention, margin structure, capital intensity and the return on each incremental dollar, and then research only the one or two variables where our evidence can differ from the market's. This inverts the usual sequence, which builds a forecast and then compares the output with the price, and it is a better use of the research budget because most variables in any model are agreed, so work spent on them produces agreement. Close the exercise on the implied return on the incremental dollar and identify the first datapoint that would confirm or deny the variable in question. That datapoint is what converts a valuation into a monitorable position.
A single forecast is a meaningless anchor against changing conditions. The work to be done is instead a rough valuation for each slice of the possible futures, combined into a probability-weighted expected value, with the slices defined by the genuinely uncertain variable rather than by arbitrary bull, base and bear labels applied to a growth rate, and that bar-bell distribution should be considered the valuation, not the single slice through the 50% median. It is continuously re-weighted as new information arrives, and any sign of travel down the lower-valuation slices triggers a sale and the promotion of whichever position has received the more favourable adjustment, which makes the portfolio a live ranking. A discounted cashflow is least reliable when the business is changing fastest, and that is also the moment the spreadsheet is granted the most authority, because uncertainty makes people reach for something that looks rigorous.
Most of this machinery lives inside the investor's mental model rather than in Excel. The spreadsheet is the communication layer and the mental model is the decision layer, and confusing the two produces the typical institutional failure of a beautifully specified model built on a variable nobody has thought about.
4.2 Growth duration classification
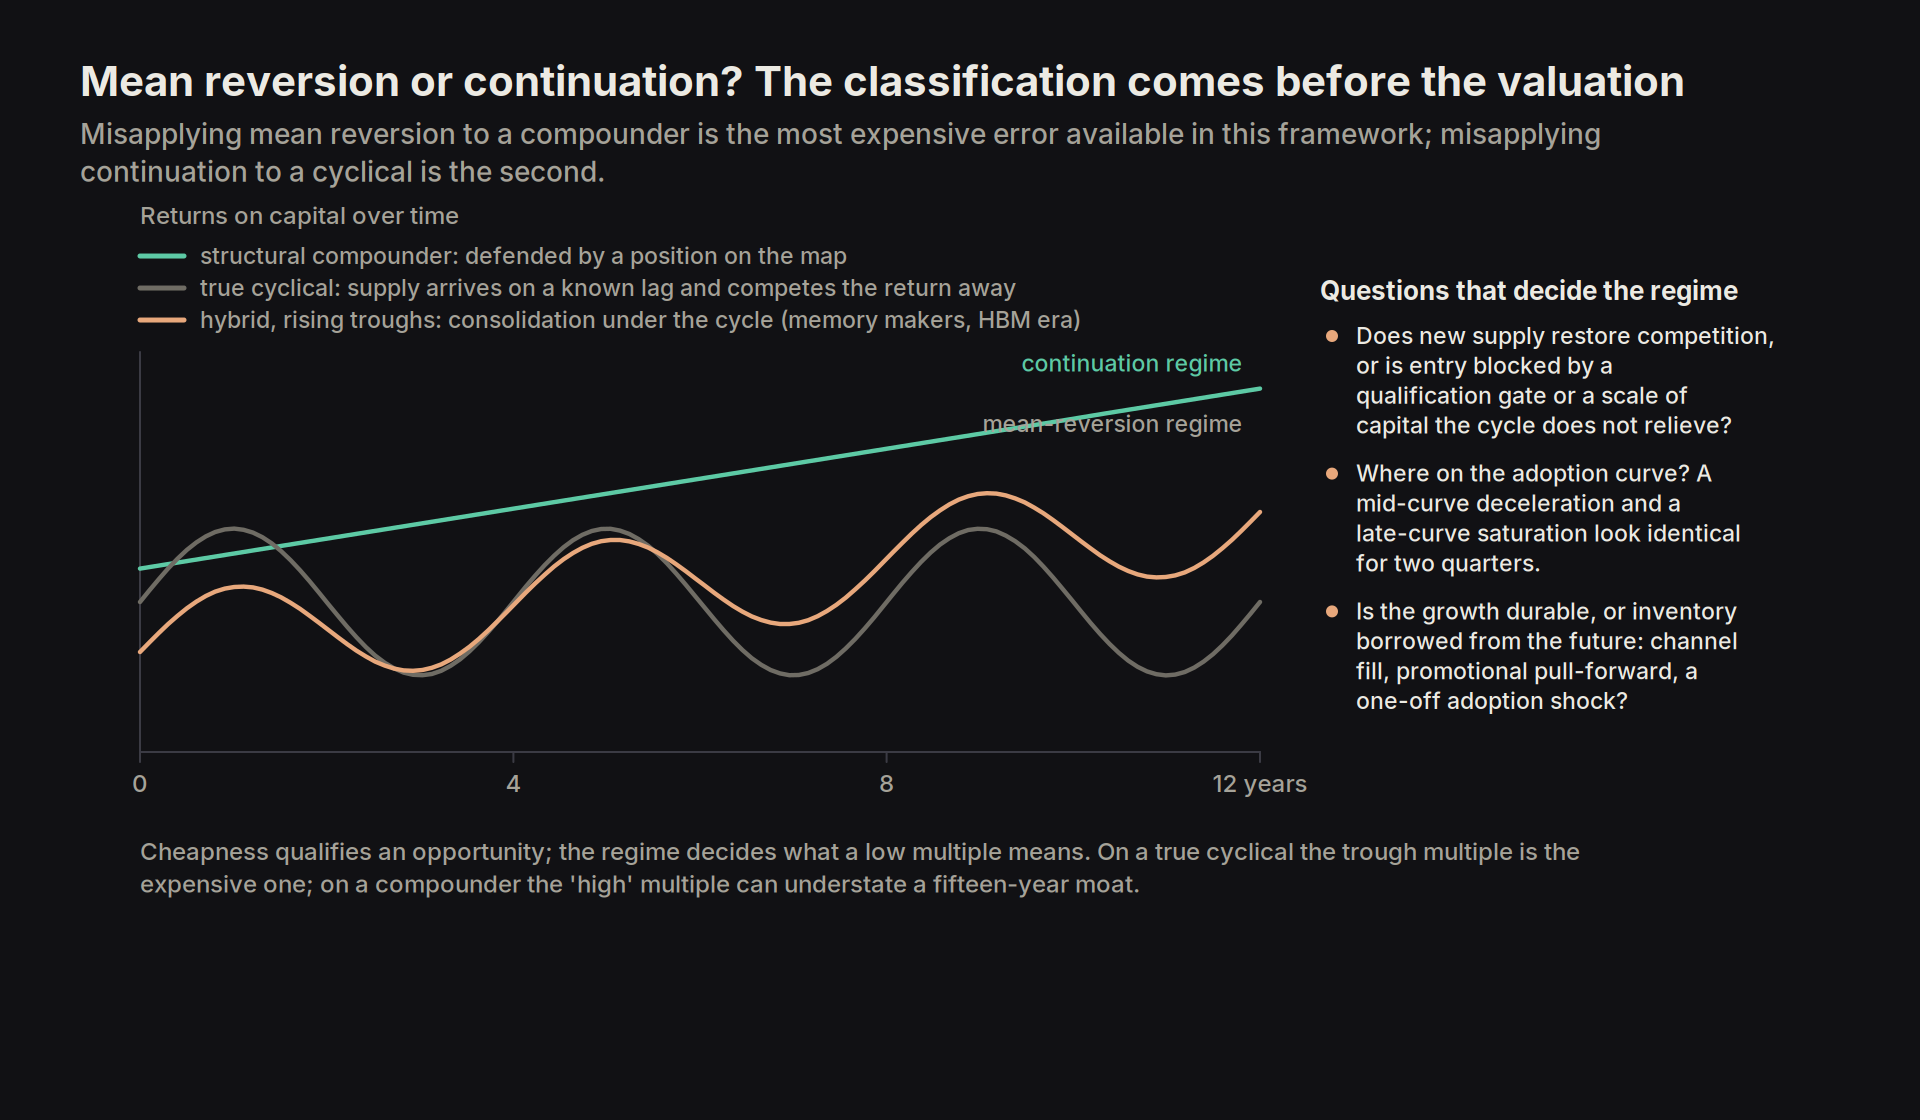
Mean reversion and continuation are different regimes requiring opposite handling, so the question of which applies is answered before the valuation. Is this a structural compounder whose returns are defended by a position on the industry map, a true cyclical whose returns will be competed away by supply arriving on a known lag, or a hybrid whose troughs are rising because the industry is consolidating underneath the cycle? Does new supply restore competition, or is entry blocked by a qualification gate or a scale of capital that the cycle does not relieve? Where does the business sit on the adoption curve, since a mid-curve deceleration and a late-curve saturation look identical for two quarters and value differently by a large factor? Is the growth durable, or is it inventory borrowed from the future through channel fill, promotional pull-forward or a one-off adoption shock? Misapplying mean reversion to a compounder is the most expensive error available in this framework, and misapplying continuation to a cyclical is the second.
4.3 Portfolio construction and risk
Construction starts with the bench. We keep an active list of researched names that carry less first-principles work than the held positions. A bench name is promoted when its range of outcomes improves and a held position's does not. Every reallocation is therefore a comparison between two researched alternatives, never a view on one name alone.
Position size is earned on four things: the quality of the evidence, the durability of the moat, the asymmetry of the valuation, and the clarity of the falsifier. The last one binds. A compelling story with no failure condition we can monitor does not justify concentration, because concentration without a falsifier is a bet on our own consistency bias. So the falsifier is written down before entry, which means the exit-on-disproof rule applies before the position even exists. The cap on any single name is set by how wide that falsifier is, not by how confident we feel, and there is a hard ceiling no name can breach whatever the evidence.
Four pieces of sizing arithmetic run against intuition.
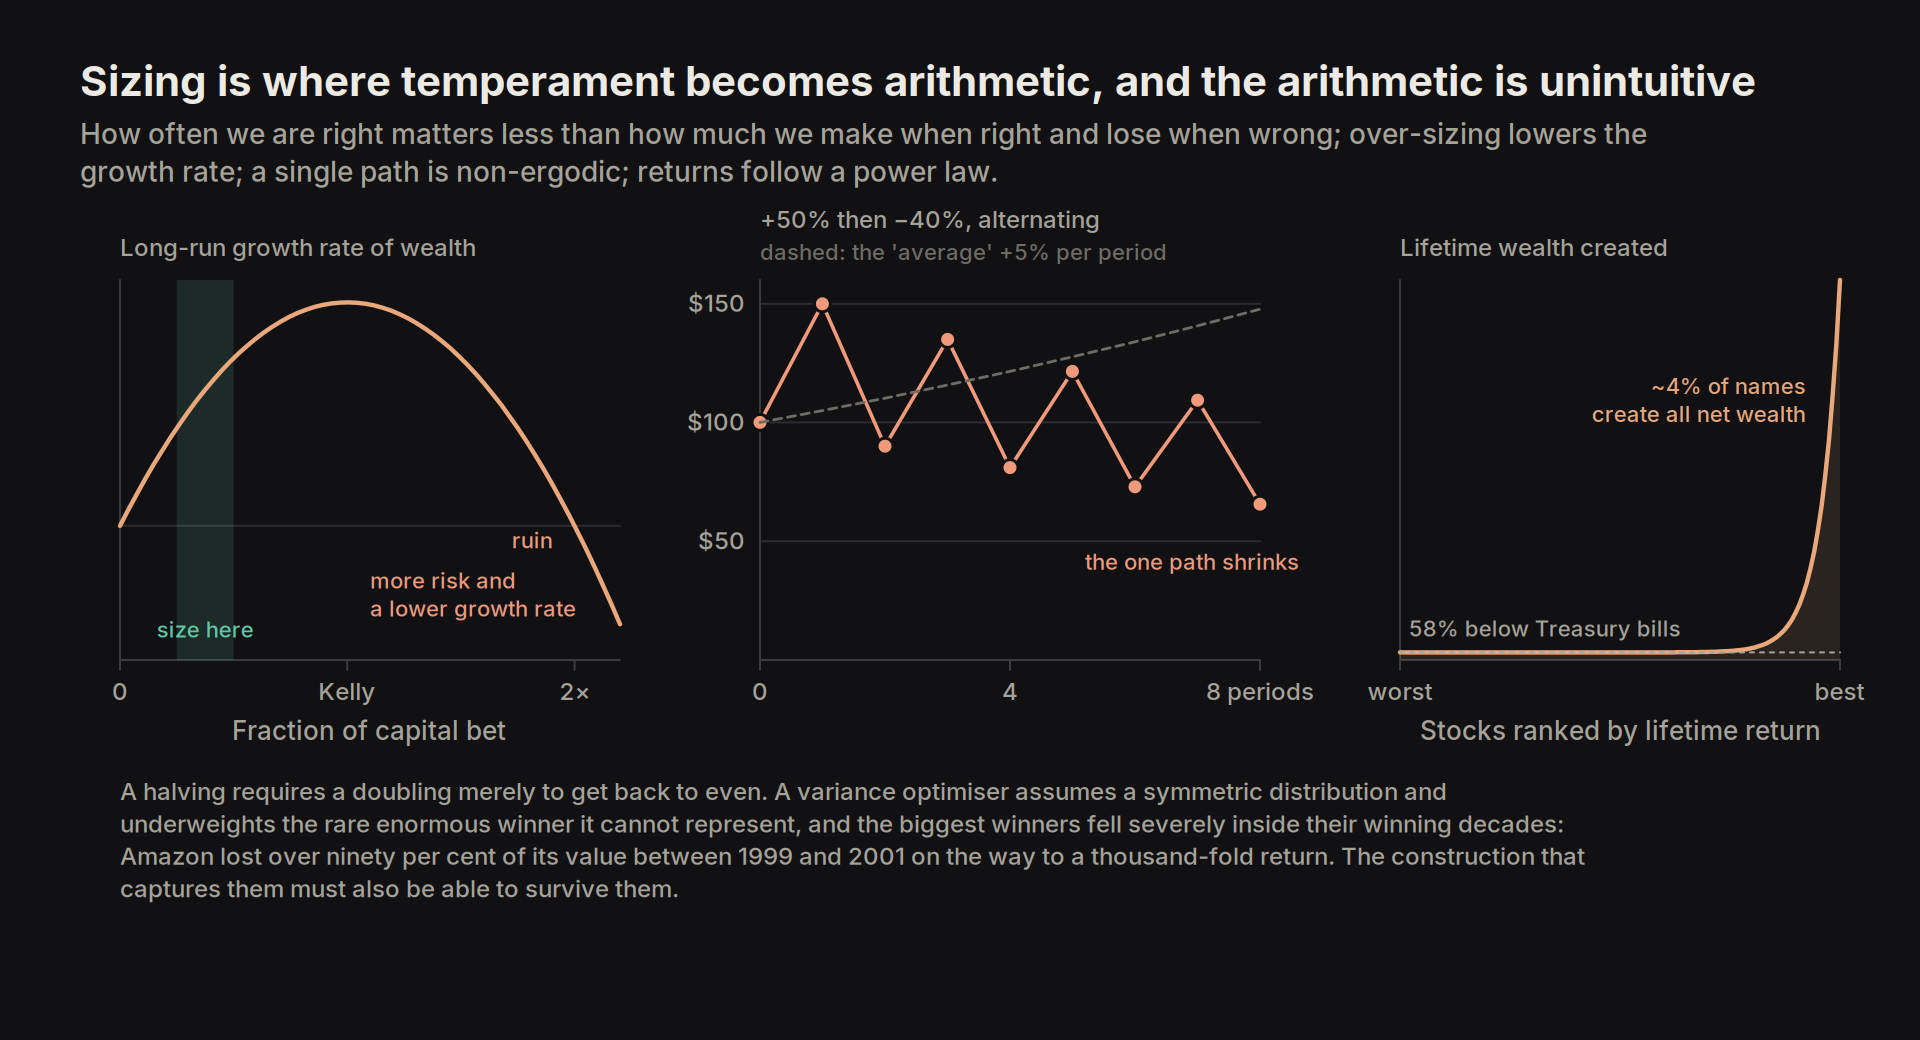
- How often we are right matters less than how much we make when right and lose when wrong. A book that is right most of the time in small size, and wrong occasionally in large size, loses money however good its hit rate looks in review.
- One investor's path is not the average across many investors. A single portfolio compounds along one sequence of outcomes, so losses cost more than gains of the same size are worth: a halving needs a doubling just to get back to even, and the gap widens as the loss deepens. A bet with a positive average return can still shrink wealth. A position that alternates gains of fifty per cent and losses of forty per cent averages plus five per cent a period, yet a hundred dollars goes to a hundred and fifty, then ninety, then a hundred and thirty-five, then eighty-one, and keeps falling. Peters calls this non-ergodicity.
- The Kelly criterion sizes for that single path. It says the share of capital to commit should rise with the edge, the gap between what we expect to make and what the odds imply, and it gives the size that maximises the long-run growth rate. Betting more than that does not just add risk. It lowers the growth rate and raises the chance of ruin at the same time. We never know the edge precisely, so we size well below what the formula says, cutting for uncertainty about our own estimate as well as about the outcome.
- Stock returns follow a power law rather than a bell curve. A handful of names drive most of a decade's return. Across the whole history of the US market, around four per cent of stocks account for all the wealth created above Treasury bills (Bessembinder). An optimiser built on variance assumes a symmetric distribution and cannot represent the rare enormous winner, so it underweights it. Acting on this is hard, because the biggest winners fall hard inside their winning decades. Amazon lost over ninety per cent of its value between 1999 and 2001 on the way to a thousand-fold return. A portfolio built to capture such names has to be able to survive holding them.
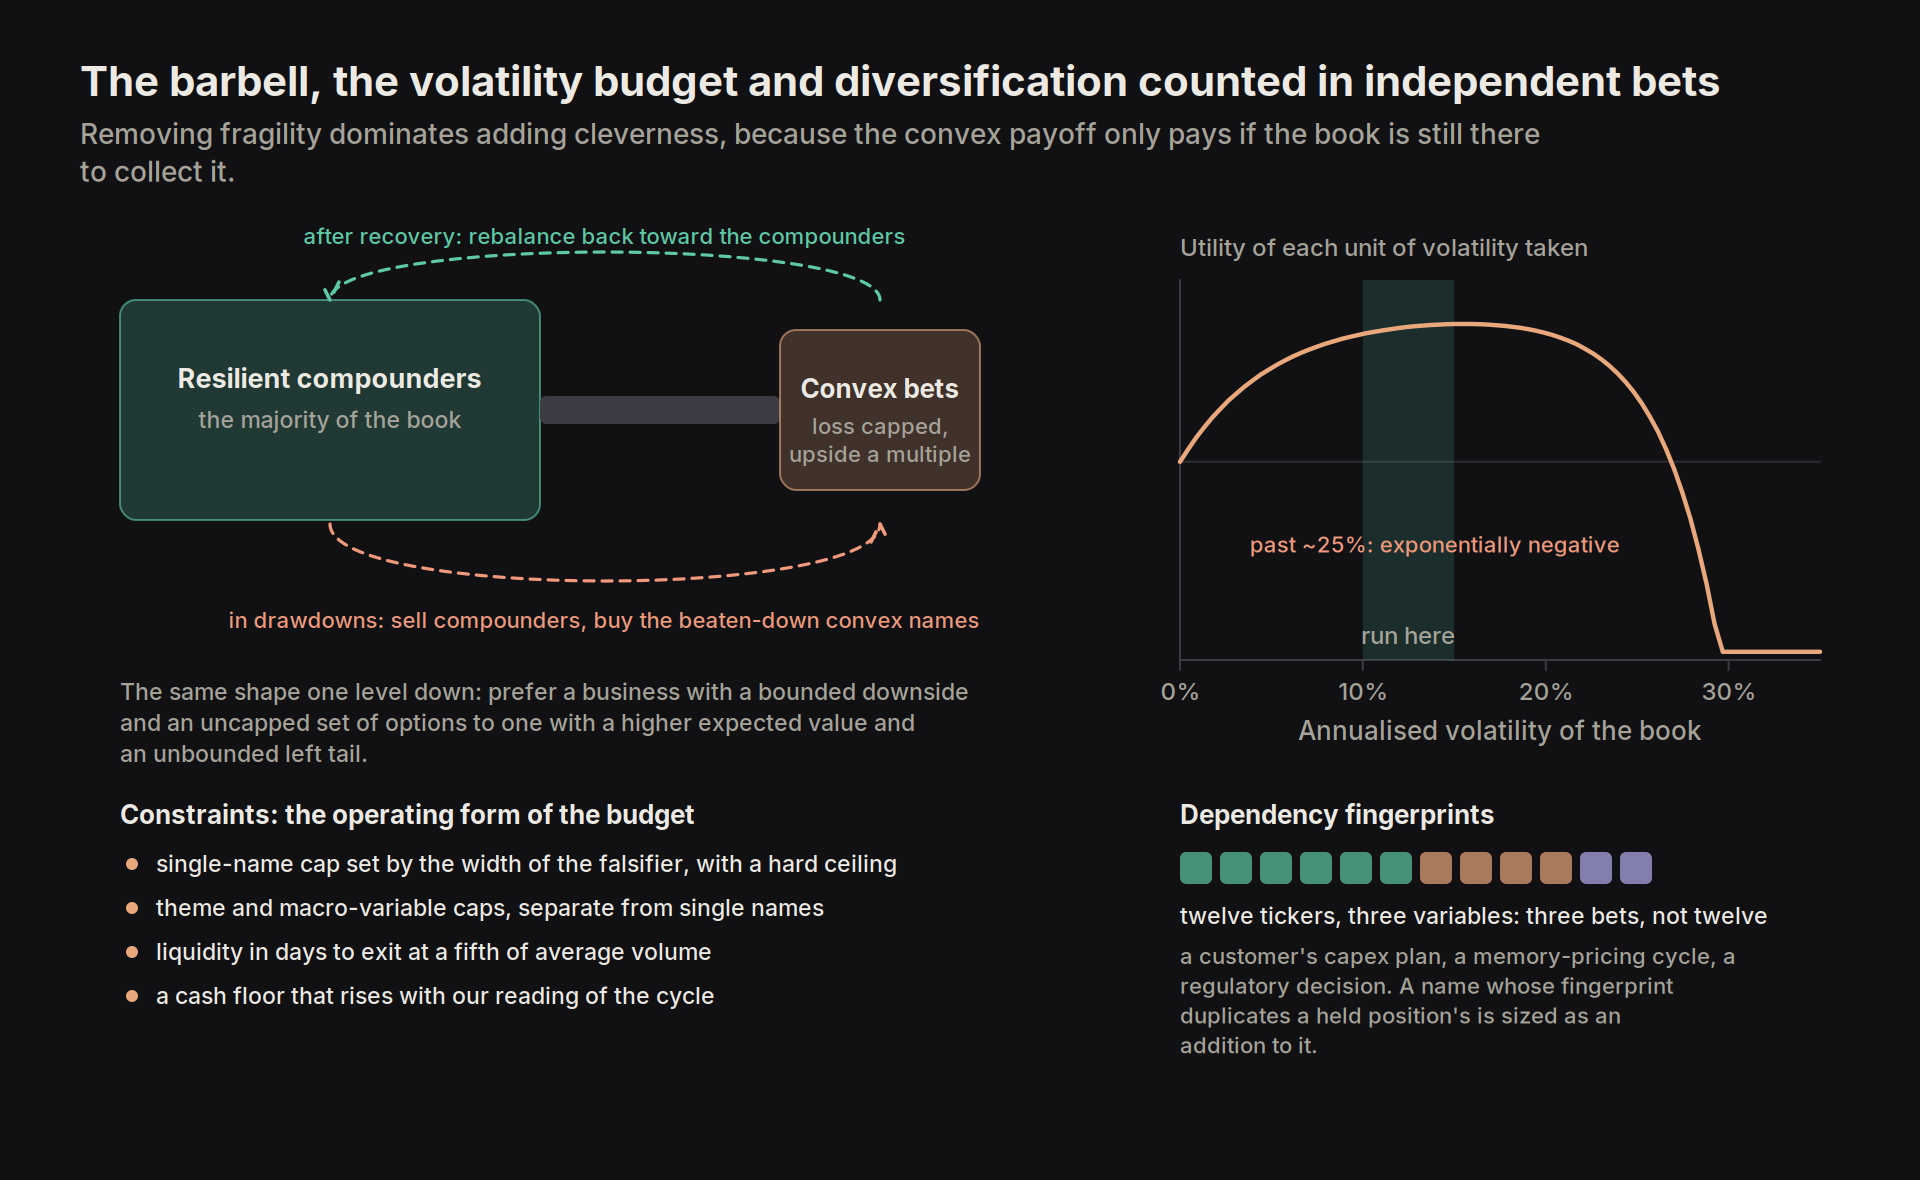
The barbell is the shape that handles all four. Most of the book sits in resilient compounders. A minority sits in convex bets, where the loss is capped at the position and the upside is a multiple. In a drawdown we sell resilient compounders to buy the beaten-down convex names, which have gained margin of safety at the lower price. Once markets recover we rebalance back towards the compounders. The same shape applies to the businesses themselves: a company with a bounded downside and an open-ended set of options is preferred to one with a higher expected value and an unbounded left tail.
The volatility of the book is budgeted rather than minimised. Some volatility is the price of any return above the risk-free rate, so the first units taken are worth having. The benefit flattens at around ten to fifteen per cent annualised and turns sharply negative past about twenty-five, because of the loss asymmetry above, so the book is run inside that range. Three constraints are the budget's working form. Exposure to any one theme or macro variable is capped separately from single-name exposure. Liquidity is measured in days to exit at a fifth of average volume, and the illiquid tail is sized so it can be held to convergence without ever forcing a sale. Cash is held inside a range whose floor rises as our reading of the cycle approaches a peak, rather than being whatever is left over.
Diversification is counted in independent bets, not in names. A barbell whose compounders and convex bets are all long the same variable is one position wearing thirty tickers. So each thesis is given a dependency fingerprint: the two or three outside variables its bull case actually rests on, such as a customer's capex plan, a memory-pricing cycle, a regulatory decision, or the rate of enterprise AI adoption. We read the book across those fingerprints, so concentration the market prices as separate is visible to us before it shows up in the returns. A name whose fingerprint matches a held position is sized as an addition to that position rather than as a new one.
4.4 Selling
Selling is the half of the discipline the tenets state most confidently and practitioners run worst, because loss aversion, the disposition effect and the desire to break even all operate on the exit, and none of them operate on the entry with the same force. Four triggers exhaust the legitimate reasons to sell, and each is written into the position at entry so that the decision is recognised rather than made.
- Disproof. The written falsifier has been observed, or the position has begun travelling down the lower-valued slices of the probability-weighted distribution. The sale is immediate and without reference to the loss taken, the tax year or the hope of recovery, because the original case was the only reason to hold and the price at which we bought is information about us rather than about the business.
- Convergence. Price has reached the probability-weighted value and the loaded spring has unwound. This is the trigger most often mishandled in the opposite direction, and the error has a name: selling a Walmart early, at three times cost in year four of a forty-year compounding, is a larger loss than the same sum lost to bankruptcy, and it persists because it never appears in the record, since a bankruptcy is recorded as a loss while a forgone twenty-bagger is recorded as a gain, so the accounting itself trains the wrong behaviour. Convergence is thus tested against whether the business has been correctly classified before it is acted on: a structural compounder whose implied competitive advantage period has lengthened on the evidence has not converged, however far the price has risen, because the value moved with it.
- A better use of the capital. The bench of researched but unheld names holds one whose distribution has turned more favourable while the held position's has not, so the reallocation is a comparison between two researched alternatives rather than a view on one. This is the only trigger that can sell a position that is still working, and it is the mechanism by which the book stays a live ranking.
- Regime change. The industry map has moved under the position, whether through a new constraint, a supply response, a technology that shifts the asymptote, or a shift in what regulators or geopolitics will tolerate, so that the thesis is no longer the one that was underwritten even if none of its stated variables has yet been falsified. Thesis drift, where the reason for holding has quietly become a different reason from the one written at entry, is the version of this trigger most easily missed without a dated record of the original thesis to check against
- Spike in uncertainty - Geopolitical events, financial crisis and other general increases in uncertainty around long term prospects that are underpriced by the market necessitates a movement to low volatility assets. The alpha of the value investor is in monitoring and perceiving these events ahead of time and being able to assess their impact on long term portfolio cashflows ahead of time before the event actually occurs. Selling with the crowd into uncertain macroeconomic events is generally what happens to the investors who have not done their homework.
4.5 Short selling
Vast majority of the adherents of the value investing school abhors short selling, and for a purpose. Shorting inverts the long-only payoff structure this framework relies on, and reflexivity makes the inversion worse. Short selling is also prone to violent squeezes, a squeeze is the crowd's reflexive attack on a thesis that may be entirely correct, and the same feedback loop between price and fundamentals runs against the short position specifically, since a rising price lowers the target's cost of capital and lets it raise equity into the enthusiasm, which repairs the balance sheet the short thesis was built on.
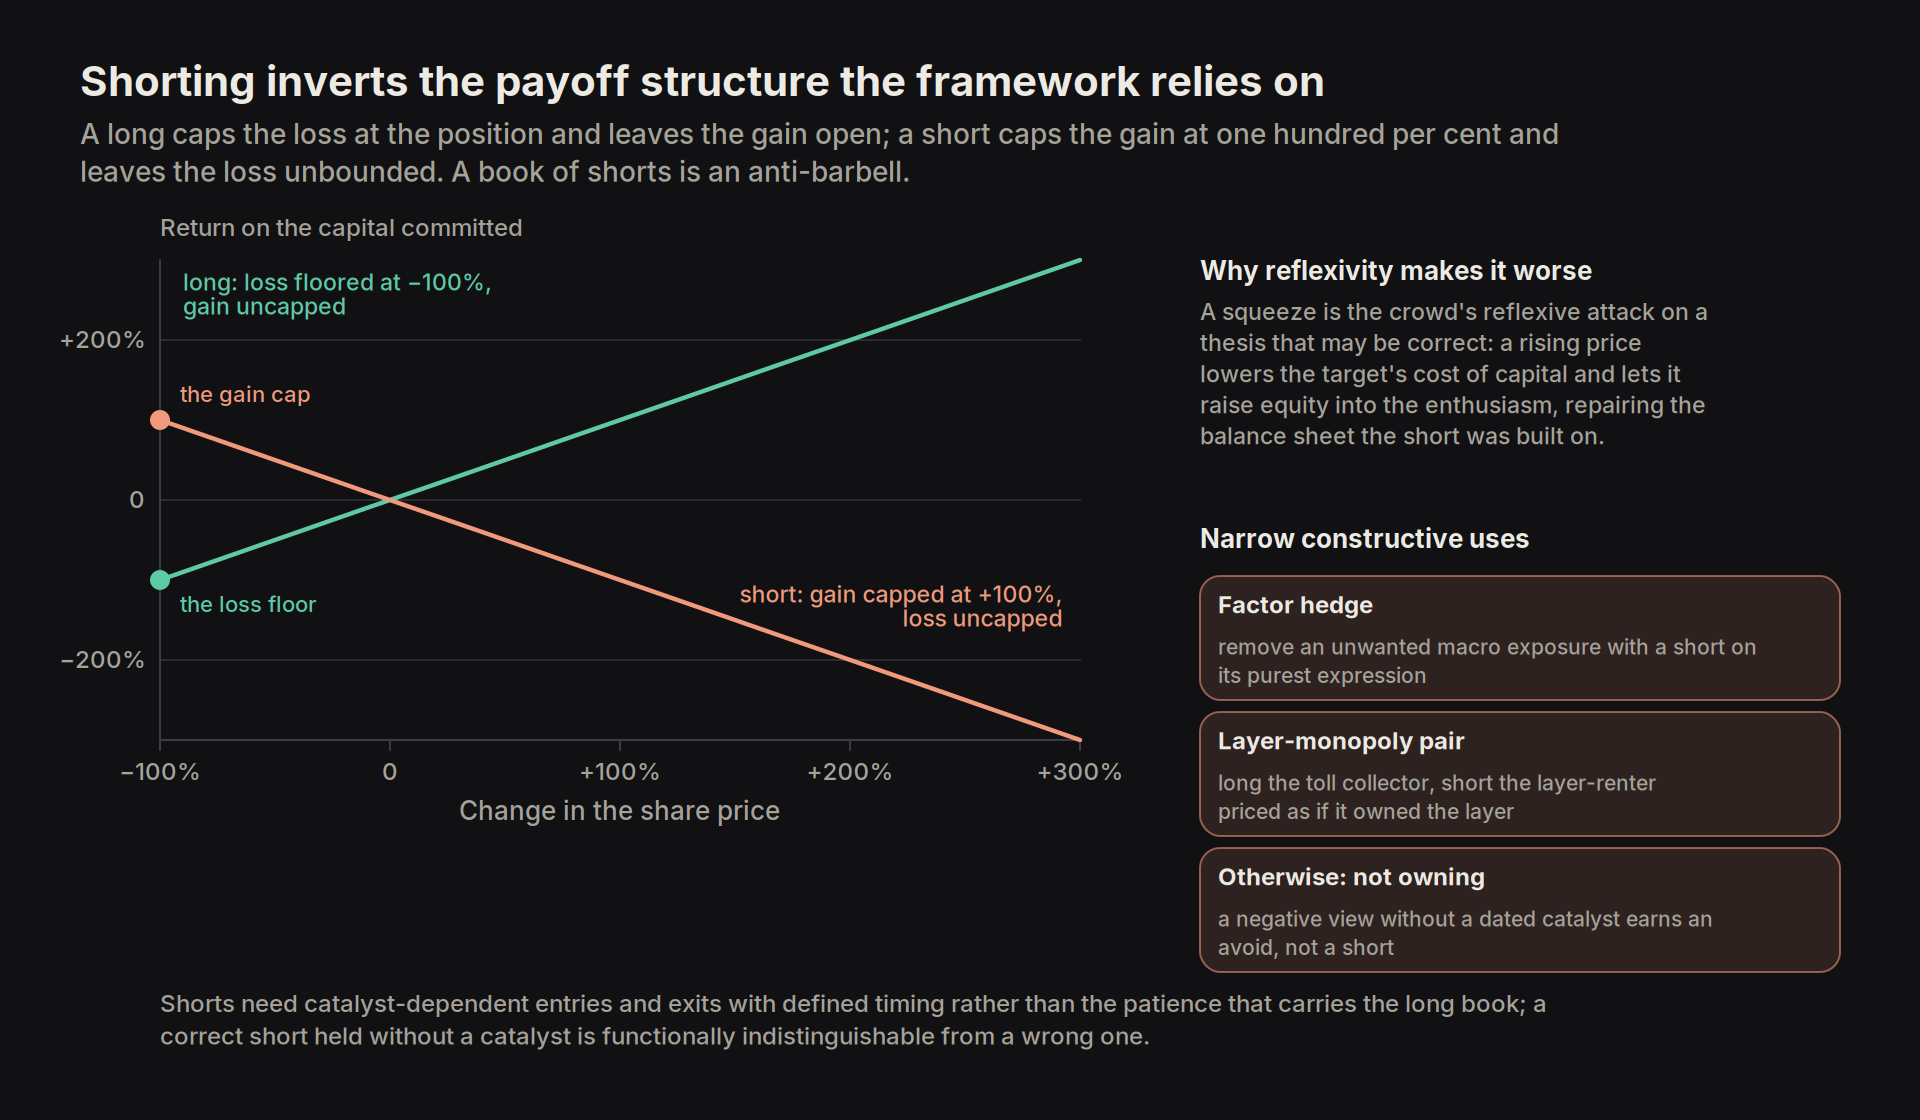
Shorts thus need catalyst-dependent entries and exits with defined timing rather than the patience that carries the long book, and a correct short held without a catalyst is functionally indistinguishable from a wrong one.
Short selling, for the astute value investor, should only be done in two scenarios:
- As a natural byproduct of long only research, where no incremental energy has been expended on 'looking' for a short, but an opportunity with a clear catalyst (that is aligned with research towards a long position) has emerged. In this scenario, a small position in put options (if the IV is appropriate) is the best way to enforce this catalyst driven short perspective
- A short can hedge a factor the long book is unintentionally long, when a position's dependence on some external variable exposes it to a macro factor we hold no view on and the cheapest way to remove the exposure is a short on the purest expression of that variable rather than a smaller long. This should only be done if there are 'clean pairs' and there is strong evidence of direct anti-correlation along known unknown variables and limited exposure along unknown unknowns. In our experience these type of opportunities are rare and few in between, and we caution against the typical approaches of long/short hedge funds that spuriously look for pair trading relationships.
4.6 The comparable companies delusion
Comparable-company analysis was useful when an industry was genuinely undifferentiated, with many competitors, often in different geographies, doing the same thing. Today, with the economic landscape consolidating as software makes coordination cheaper and large globalised firms dominate each particular end market vertical, there are far fewer genuinely comparable companies, and the method has lost most of the conditions that once justified it.
The nearest economic peer of a business often sits outside its reported sector, since classification follows where the revenue comes from rather than how the business works (e.g. a subscription data business classified as 'media', or a consumables-driven instrument maker classified alongside capital-equipment cyclicals). A peer set assembled from the industry code excludes the companies whose economics actually rhyme and includes companies whose only similarity is the end market. Using a comparable multiple also outsources the entire terminal assumption to whoever set the comparable's price.
A multiple is a compressed discounted cashflow with the investment line deleted. Two businesses with identical earnings and different capital intensity carry radically different values and identical multiples, so the comparison the multiple is meant to enable is the one thing it cannot support. The zero-spread case demonstrates it. A business that earns exactly its cost of capital, say ten per cent on capital that costs ten per cent, is worth the same multiple whether it grows at two per cent or at twenty, because every incremental dollar reinvested returns exactly what it costs and adds nothing. Growth is worth nothing when the spread between return and cost of capital is zero, and it destroys value when the spread is negative. Growth is thus an amplifier whose sign is set by the return on incremental capital rather than a valuation input in its own right, and a screen that ranks by growth without checking that return is effectively ranking companies by how quickly they are compounding their own answer, in either direction.
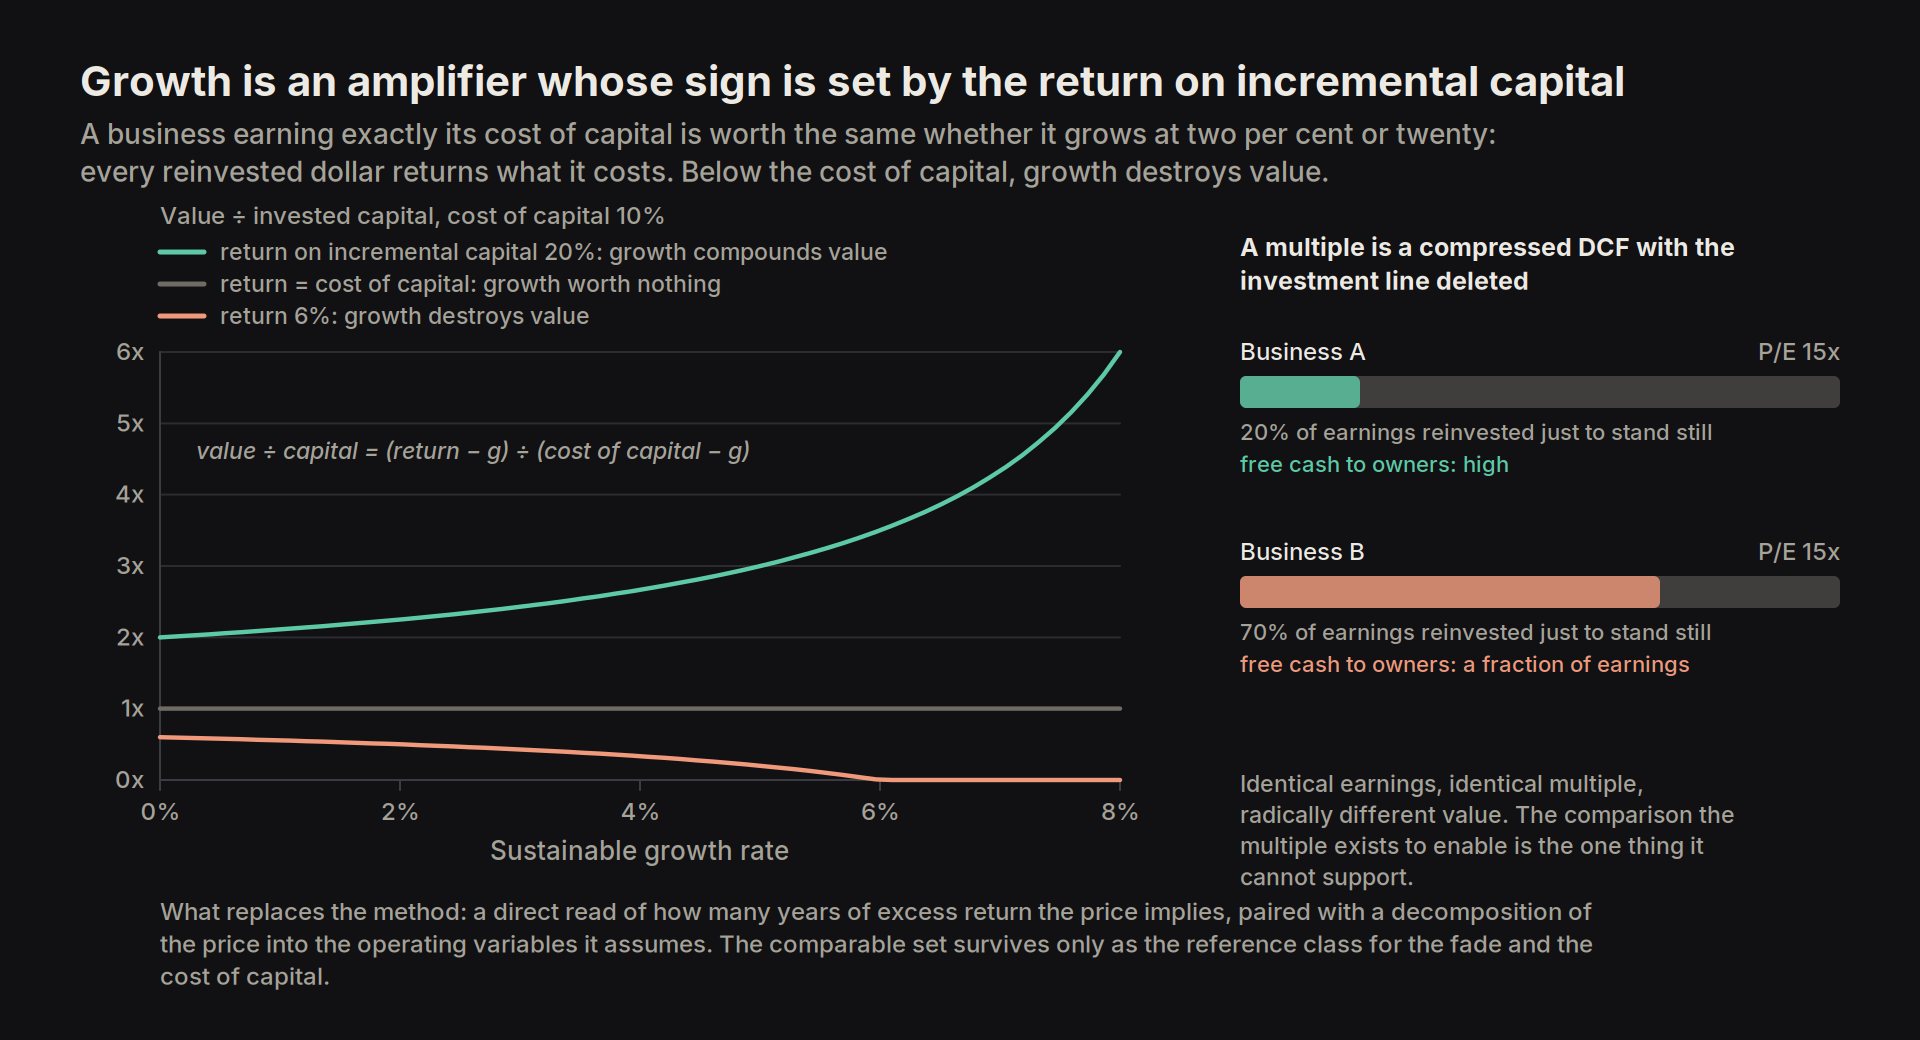
What replaces the method is a direct read of how many years of excess return the price implies, paired with a decomposition of the price into the operating variables it assumes, which between them ask the only two questions the multiple was standing in for, how long the excess return lasts and which operating variable the price is wrong about; the comparable set survives in a single role, as the reference class for the fade and for the cost of capital, where a peer's history of return persistence is a base rate and not a target multiple.
4.7 The volatility-as-risk delusion
"The greater the potential for reward in the value portfolio, the less risk there is" (Buffett, 'The Superinvestors of Graham-and-Doddsville', 1984). Whatever beta computes about the relative volatility of opportunities in the measurable short term is simply price volatility. It has nothing to do with risk, which is the permanent impairment of capital or an extended period of below-market returns. The conflation of the two, and the liberal use of Sharpe ratios (return divided by volatility) to compute 'risk-adjusted' returns, is a form of institutionalised 'capital markets psychosis', the term this essay uses for any pricing convention the industry adopts because it is computable rather than because it is true. Risk, properly, is the expected share of future scenarios in which an asset fails to converge on its assessed fair value; it cannot be measured from price data, and it is estimated qualitatively, scenario by scenario, rather than computed from the tape.
The conflation has an institutional origin. Portfolio theory needed a single number for risk that could be measured for every asset and compared across all of them, and volatility was the only candidate available from price data alone. A consultant, an allocator or a risk committee can compute it without knowing anything about the business, which is precisely why it spread. For a long-term owner it measures the wrong thing. A stock that falls forty per cent while the business's cashflows are unchanged has become less risky, not more, because the margin of safety is a property of the price paid. A stock that drifts down two per cent a year for a decade while its industry is dismantled underneath it will show low volatility and a respectable Sharpe ratio all the way to zero.
Permanent impairment arrives through a short list of routes, and each can be assessed without a volatility figure. The business can fail or be structurally diminished, through obsolescence, a broken balance sheet, fraud or regulatory action. The estimate of value can itself be wrong, a failure of competence rather than of the business. The price paid can be too high even for a correct estimate, which is the margin-of-safety question. Or the price can fail to converge in a useful time, which turns a correct thesis into dead money and an opportunity cost. The qualitative assessment thus asks, for each position, how likely each of those four routes is and how much would be lost down each. Weighting each route by its probability and its loss is what makes the answer explicit: the slices of the distribution in which value ends up below the price paid are the risk, and their combined weight is the number the Sharpe ratio pretends to be.
Volatility does become risk in one circumstance, which is when the holder can be forced to sell. Leverage, margin, redemptions and career pressure all convert a temporary price move into a permanent loss by forcing the sale at the bottom, which is why the aligned investor base is a risk-management tenet rather than an administrative preference. Absent forced selling, volatility is the source of the opportunity rather than a measure of the danger.
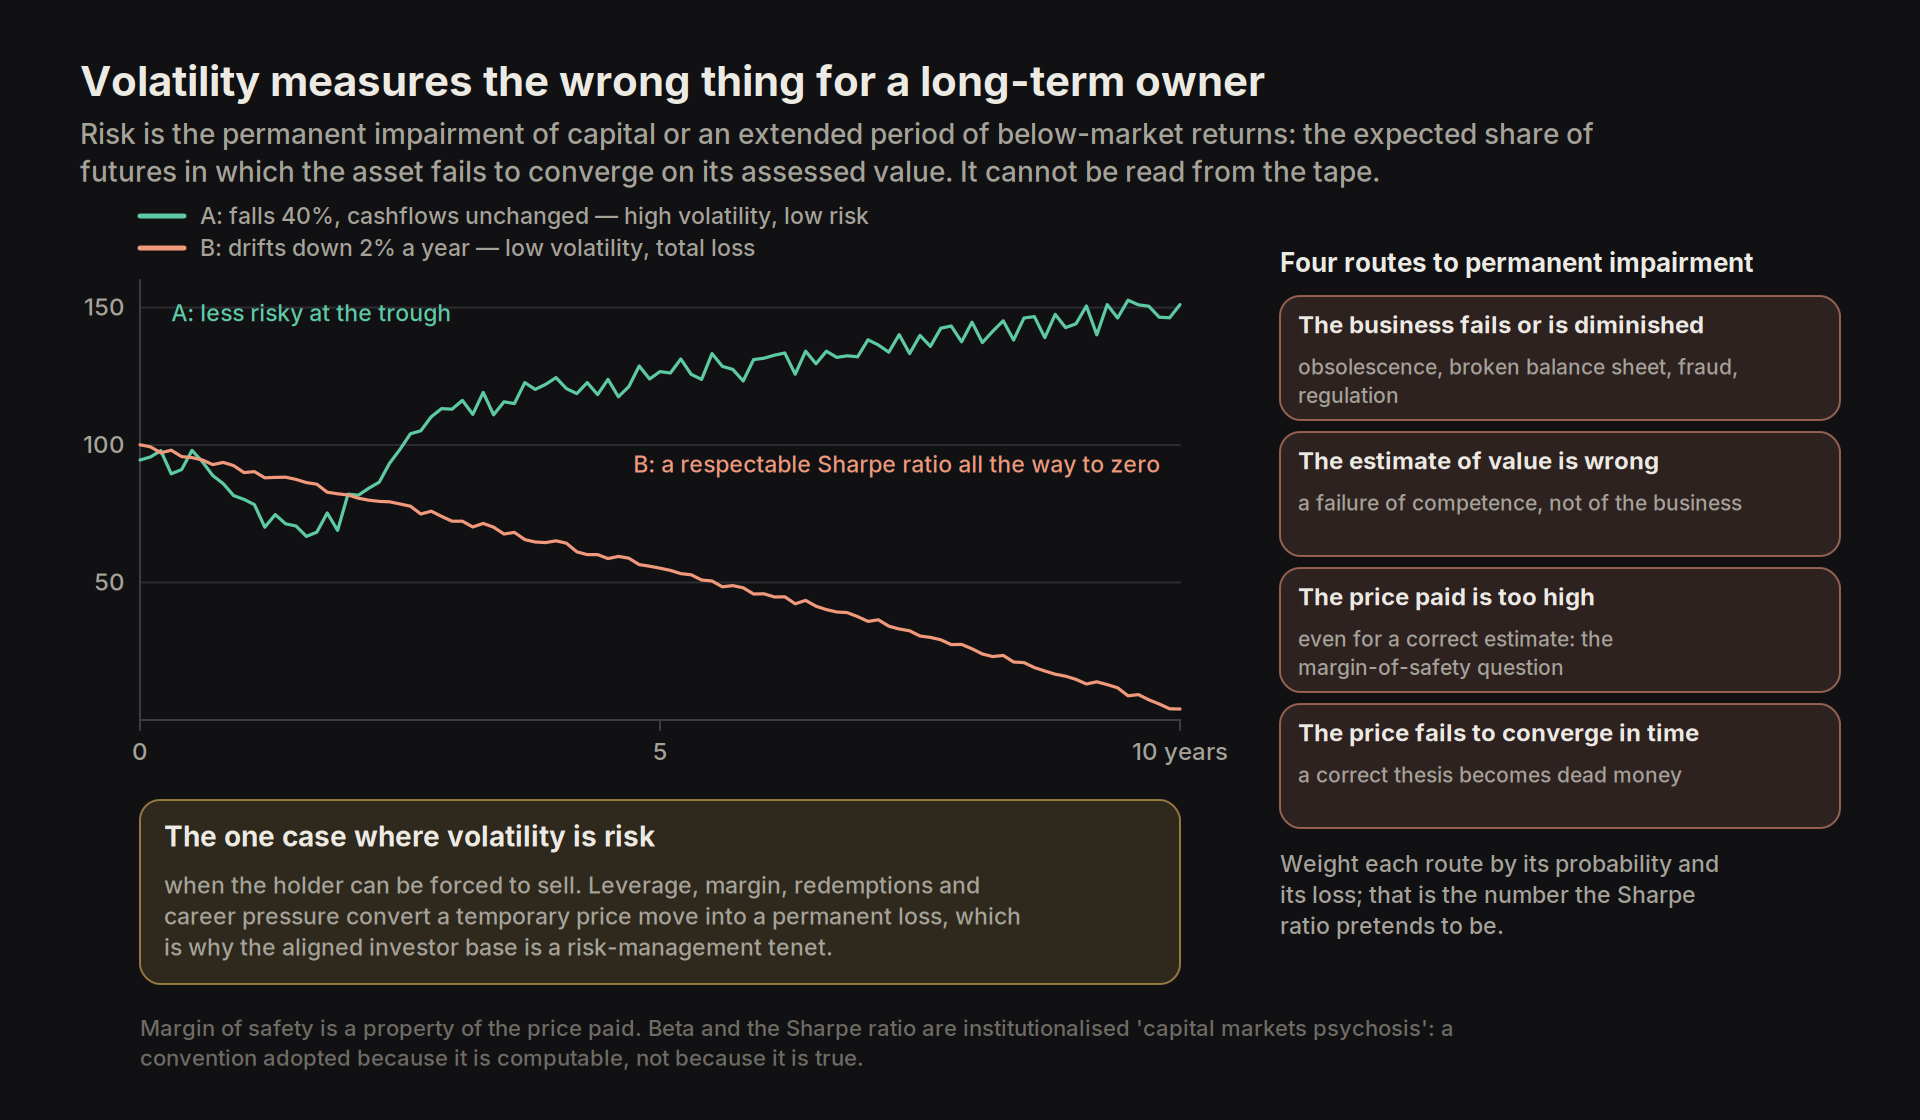
Part Five — Modern value investing in the era of hyperchange
Two conditions have changed since the value investing framework was widely adopted by Buffett and his disciples, and they push in opposite directions. One, The participant base is numerate, so the steady-state mispricing of durable businesses has been arbitraged thin and the easy half of Graham's method no longer pays. Two, Business models mutate faster, so the tails are fat in both directions and the errors available are correspondingly larger. The old question at every panic was what will not change; the modern one is what metabolises change, which is a question about organisational capacity and structural position. Answering it requires a working theory of how change arrives, how fast it diffuses, who captures the surplus it creates, and why the accounts fail to record any of it.
5.1 Limits of the hyper-traditionalist toolkit
Buffett's cohort rode post-war consumer and industrial compounding in a market that preferred bonds, and business models varied little because technology barely penetrated corporate structure beyond basic record-keeping software, so at each panic the winning question was 'what did not change', applied to securities with durable moats at low prices, and the question worked because the answer was usually 'almost everything'. Under todays environment the answer to 'what did not change' is increasingly 'less than assumed, and not knowable for three years', and the practitioners still relying on the traditional toolkit find themselves increasingly maladapted to the rate of change of the environment they are pricing.
The productive response is to re-rate Graham's durable question rather than abandon it. Change-immunity, the franchise that never faces a new technology, is rare and generally priced when it exists, because it is easy to see and every screen finds it. Change-absorption, the layer or the organisation that is antifragile (Taleb's term for things that gain from disorder and uncertainty) metabolises disruption and grows through it, is generally underpriced at the moment of maximum fear, because pricing it requires a judgement about organisational capacity rather than a multiple on trailing earnings. Bezos's inversion is the demand-side version of the same move: build around what customers will still want in a decade, lower prices and faster delivery, whatever the technology. That relocates permanence from the supply side, where technology keeps moving it, into demand, where it is far more stable.
The discipline's temperament requirements, tolerance for drawdowns, low turnover, the willingness to hold cash at peaks, are close to impossible to run inside career-risked, quarterly-redeemed vehicles, and the constraint bites hardest here, since the period over which a change-absorption thesis looks wrong is set by how long the technology takes to diffuse rather than by the market's patience.
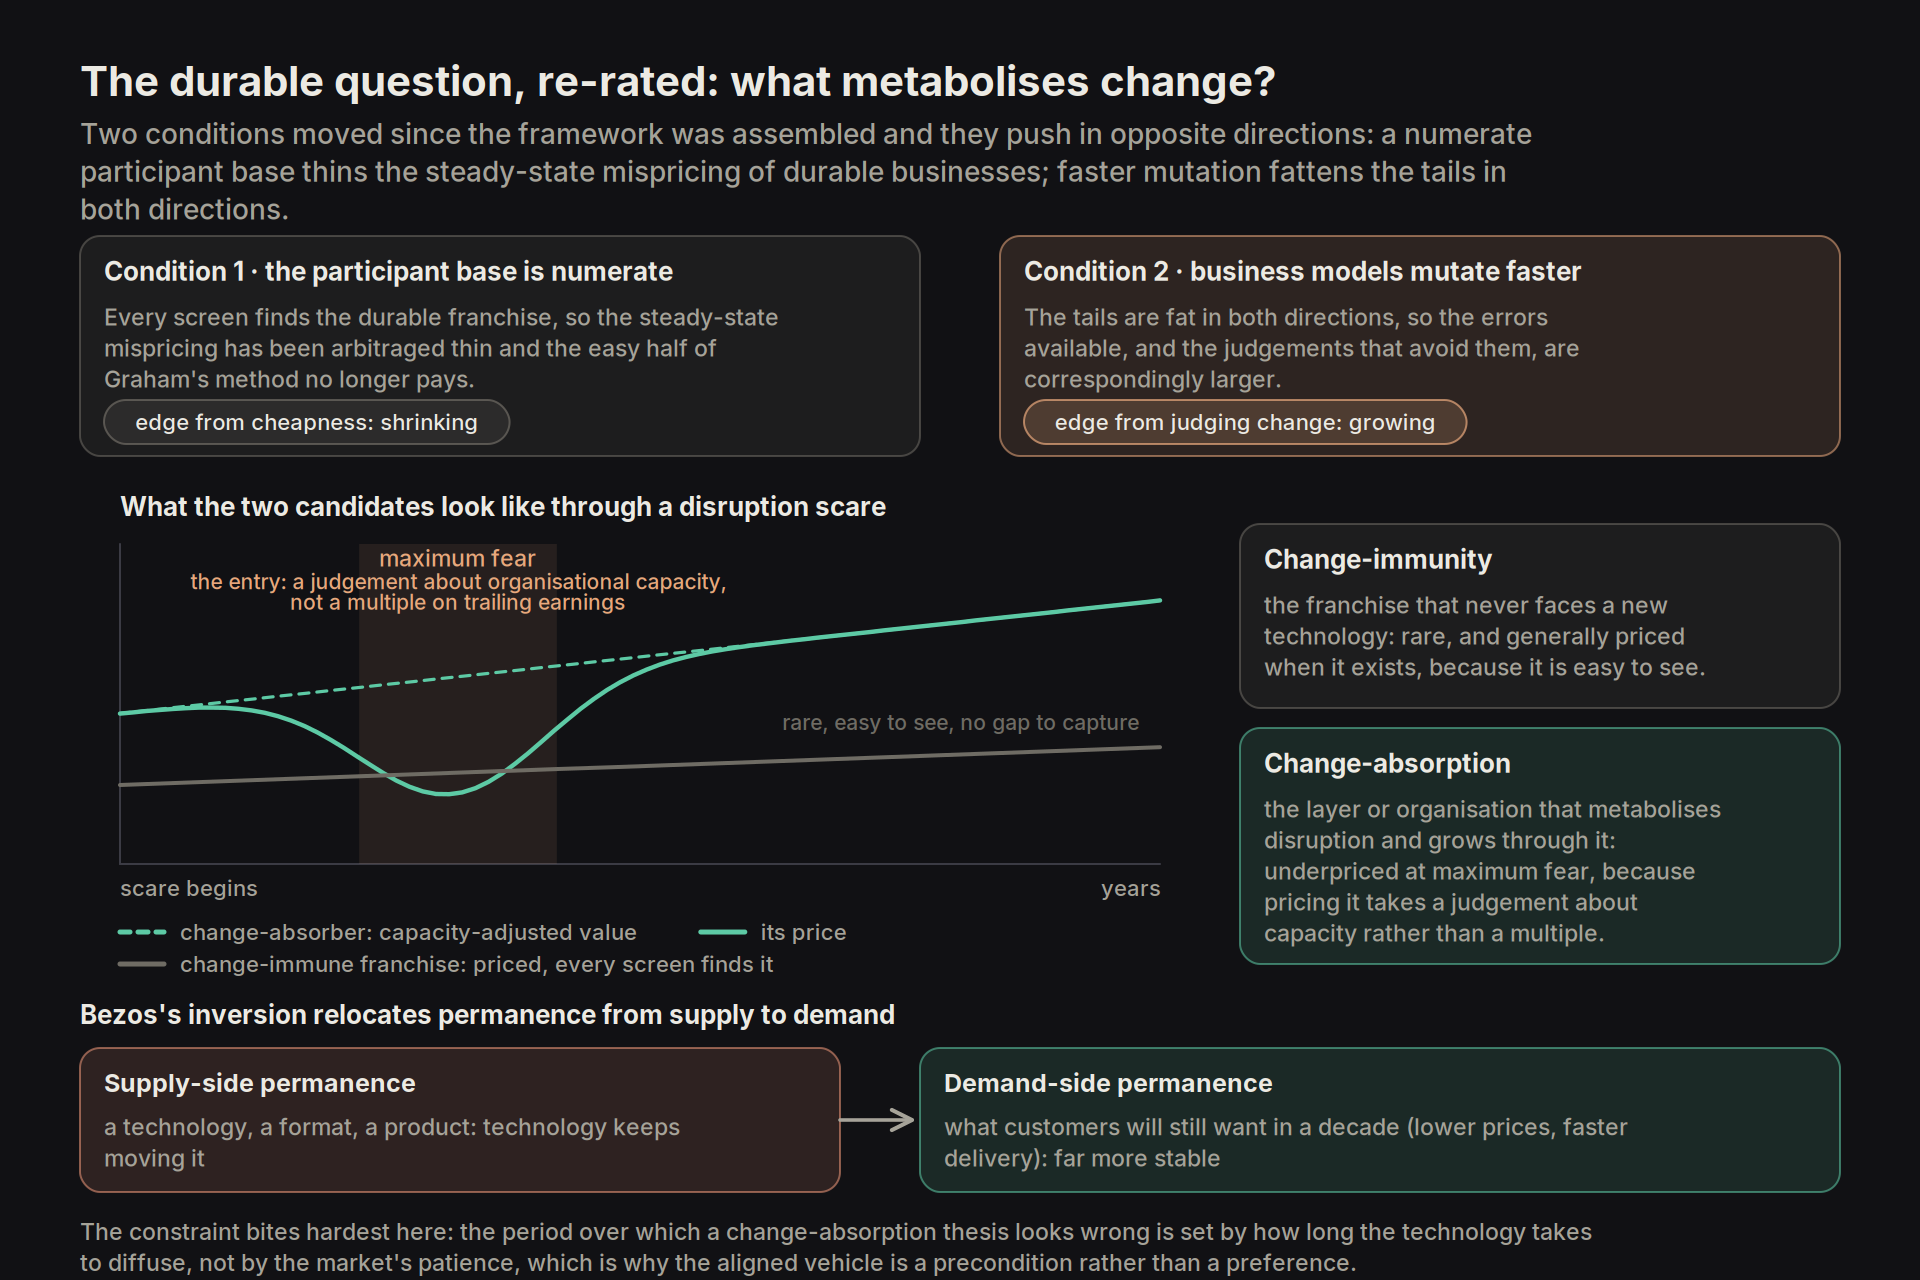
5.2 How change actually arrives
Humans model the future as a linear extension of the present, assembled from what has already happened, which is a reliable method in a stationary world and a biased one otherwise. In an age of disruption, compounding forces produce what Munger calls 'lollapalooza effects', outcomes with extreme convexity relative to expectations that occur when several tendencies act at once in the same direction, each one individually modest and the combination non-linear. Anticipating these is the job description of the modern value investor, and the practical discipline is order-of-magnitude thinking: asking whether the variable in question moves by ten per cent or by a factor of ten, because the two answers require different models and the intuitive default is always the first.
Amara's law says we overestimate what a technology will do in the short run and underestimate what it will do in the long run. The two errors are made by different people. Enthusiasts set the near-term expectations, and they run ahead of what can be built and sold in two or three years; sceptics set the long-run expectations, and they anchor on the technology as it exists today. The market price usually sits between the two, which means it is usually wrong in both directions at once.
The long-run error has a mechanism that repeats. When an adoption curve flattens, it is usually one approach that has run out of room, not the technology. A new approach starts its own curve from where the old one stopped, so the combined curve keeps rising even though each curve inside it flattens. Lighting is the cleanest case. Candles, oil lamps, gas mantles, incandescent bulbs, fluorescent tubes and LEDs each improved for a few decades and then stalled at a physical limit of their own: an incandescent filament cannot be driven hotter without melting, so its efficiency stopped improving in the 1930s. Each time, the next technology started its own curve from where the previous one stopped, and the price of light, measured per lumen-hour, fell by a factor of several thousand between 1800 and the 1990s (Nordhaus) and has kept falling since with LEDs. Every plateau looked like the end of cheap light. None of them was.
So the same chart can be misread two ways: calling the top when one curve flattens, or extrapolating the steep early section as if the whole market would adopt at that rate. The job is to work out where on the curve we are. Before the chasm (Geoffrey Moore's term for the gap between early adopters and the mainstream buyer), outcomes are close to binary and most attempts fail. In the middle, where the curve will clearly complete but the timing is uncertain, patient capital has its largest edge, because the market discounts the delay more heavily than the outcome. Late in the mainstream the growth rate is still positive but falling, and the right model is mean reversion rather than growth.
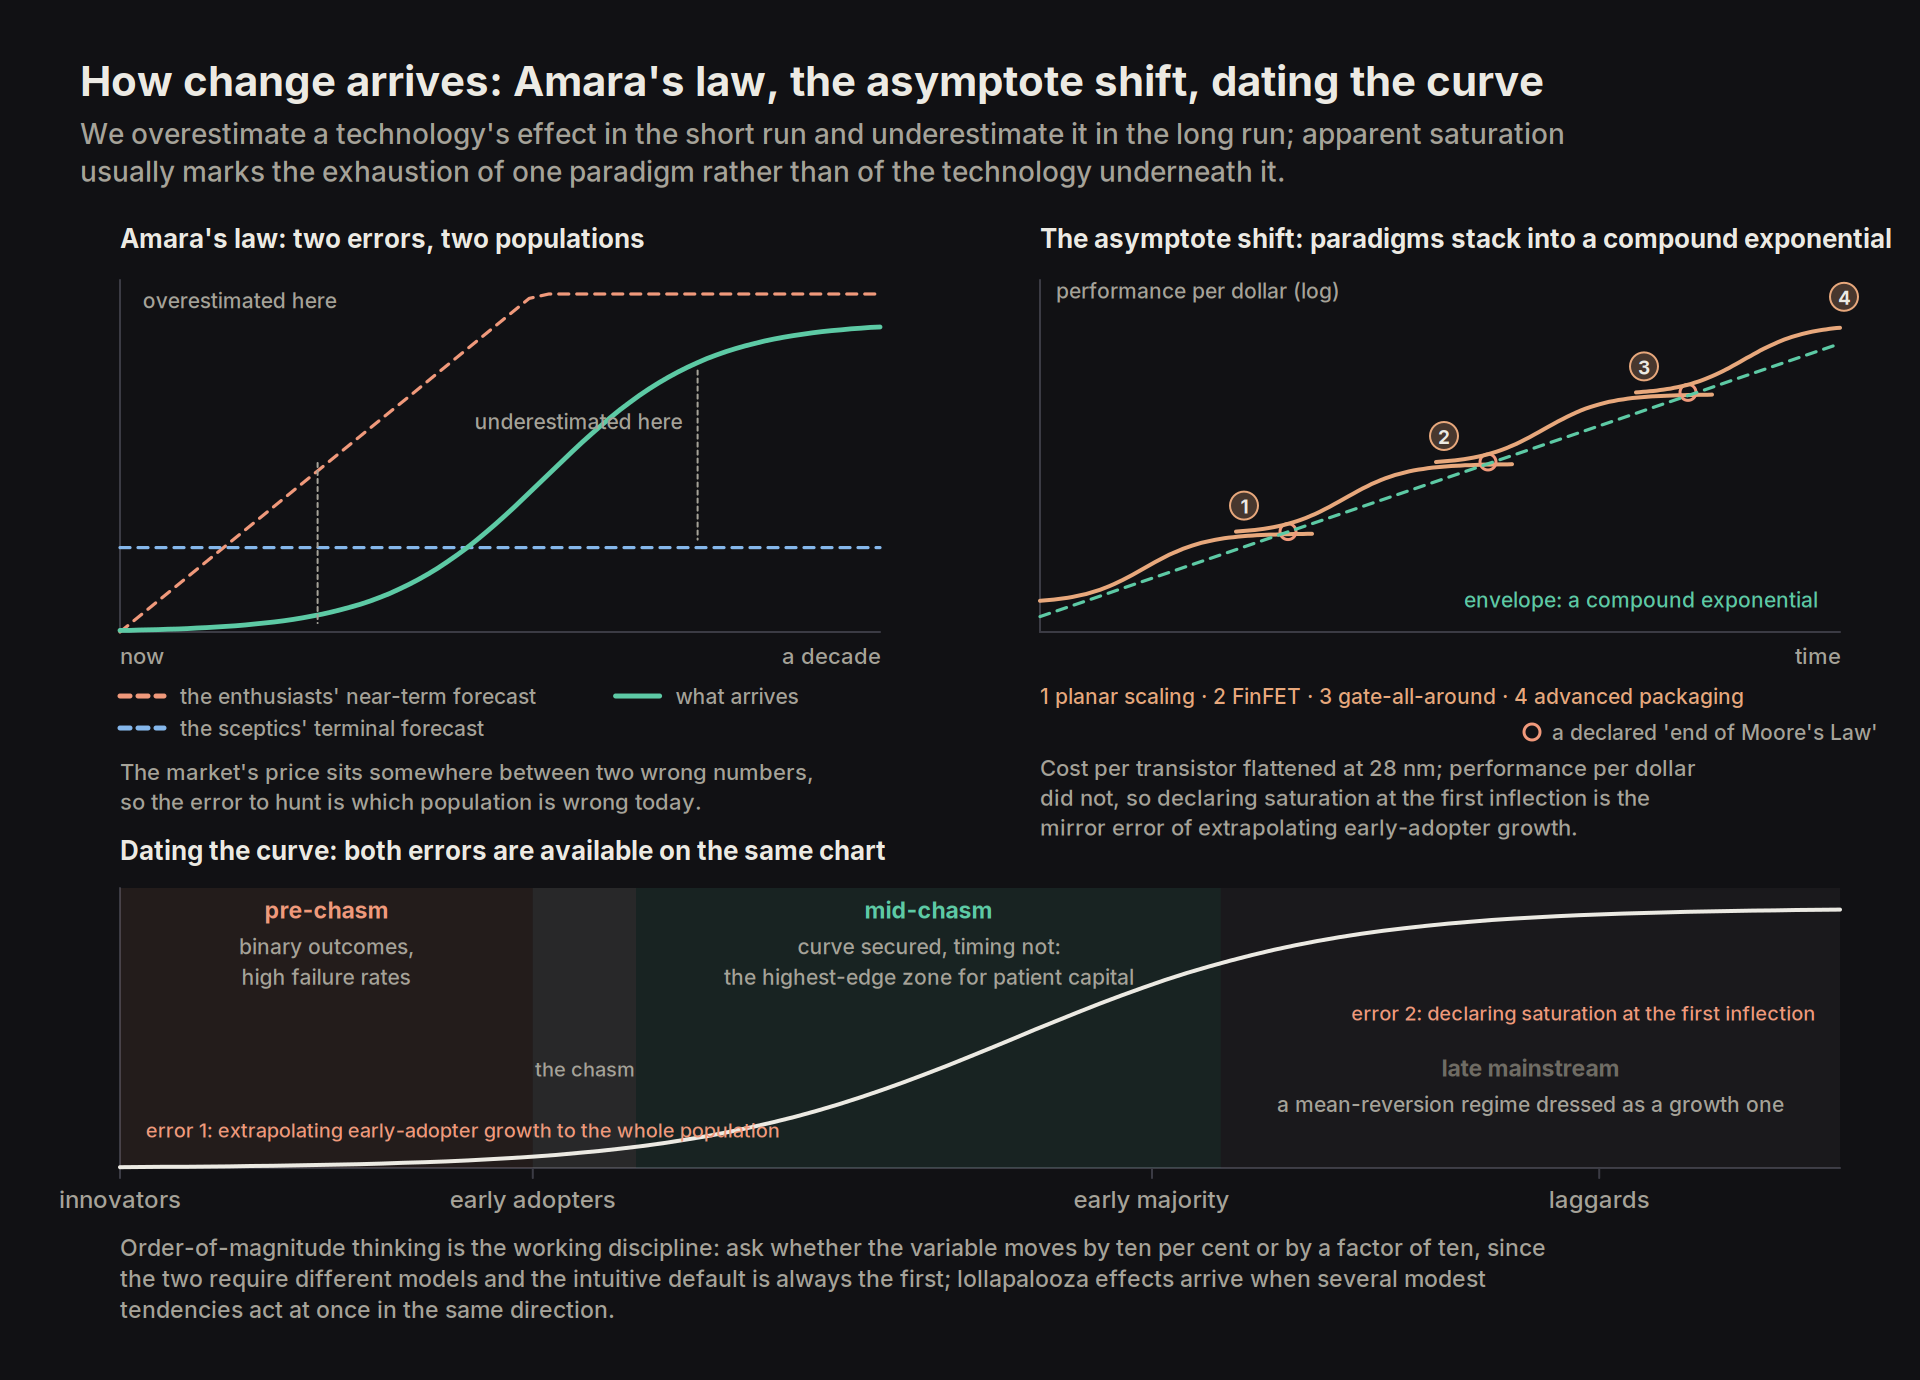
5.3 Diffusion is a social process with a cost clock
Assessing diffusion means gauging how societies, social structures, governments and other economic institutions react to a novel approach or product, not just the merits of the underlying technology, which requires modelling the psychology of each node in the adoption chain. A technology that is strictly better and cheaper can take a decade to diffuse through a regulated industry with a qualification gate, an installed base, a licensing regime and a professional body with an interest in the status quo (e.g. electronic health records, or any change to aircraft certification). The same technology can saturate an unregulated consumer market in eighteen months (iPhones, BNPL). The modern value investor thus has to understand how societies receive and react to change in order to value future outcomes at all, since the adoption timeline is usually a larger driver of present value than the eventual penetration rate. The gate cuts both ways, and the link is one the framework relies on: the industries that diffuse a new technology most slowly are the ones with a qualification gate, and the qualification-gate monopoly, where a regulator or a customer's own validation process makes switching a multi-year project regardless of price, is the most durable moat of all, so the same regulatory friction that delays the entrant's adoption is what protects the incumbent's duration, and a diffusion forecast and a moat forecast in a regulated industry are effectively the same forecast read from opposite ends.
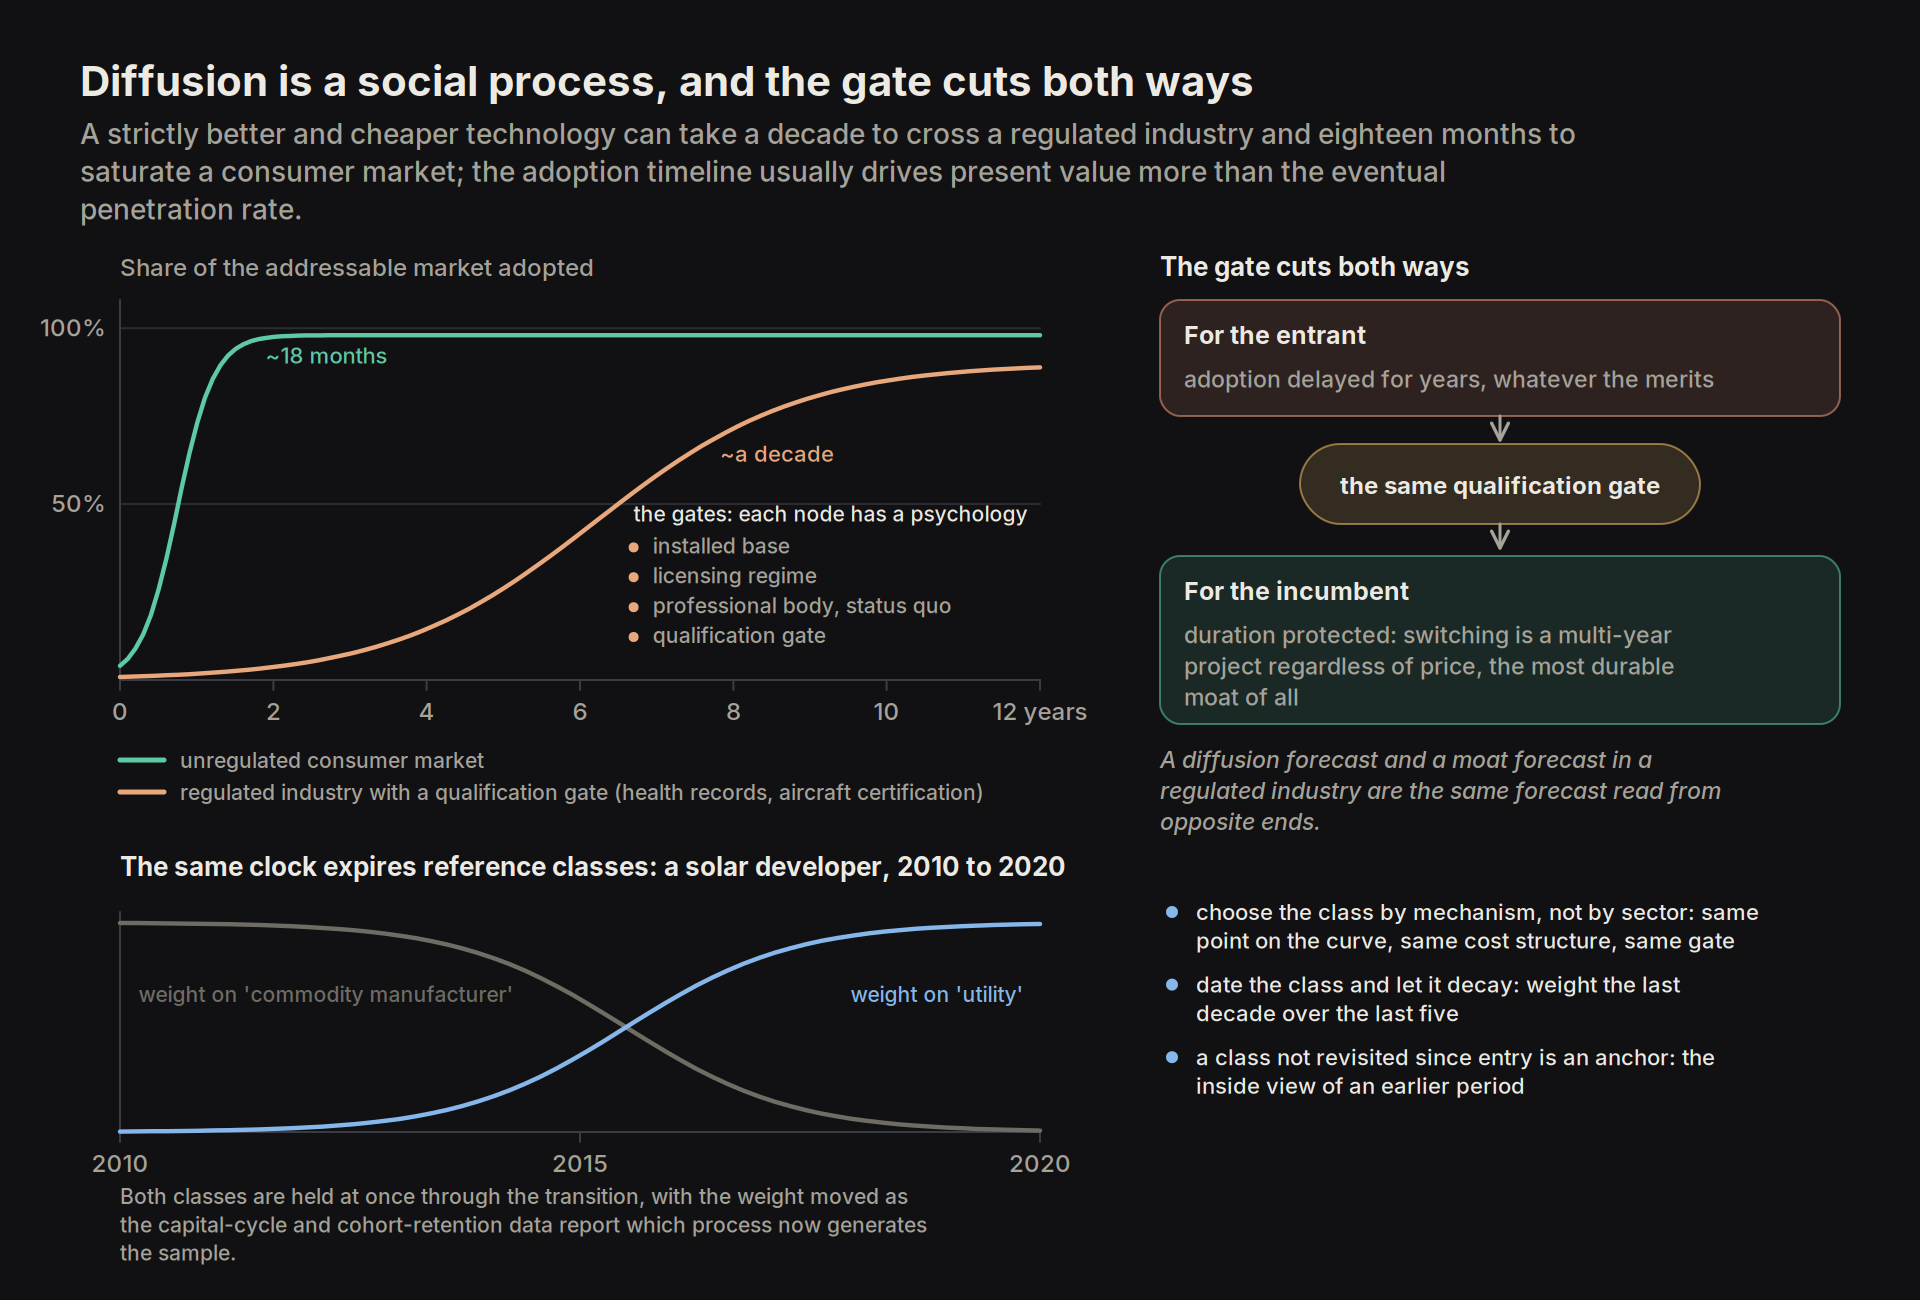
Price sets the speed of adoption. The two things a forward valuation most often gets wrong, how fast a technology is adopted and how large its market eventually becomes, both depend on price, so a diffusion forecast needs a cost model underneath it.
Wright's Law (Theodore Wright, 1936, from aircraft assembly) covers the speed. Each time cumulative production doubles, unit cost falls by a roughly constant percentage. Cost is therefore a function of how many units have ever been built, not of the calendar, and the loop feeds itself: demand raises volume, volume lowers cost, lower cost allows price cuts, and price cuts raise demand. The learning rate is stable enough within an industry to be looked up: around twenty per cent per doubling for solar modules and lithium-ion cells, lower for wind, close to zero for nuclear and most construction, where every unit is built once. Forecasts therefore rarely go wrong on the rate. They go wrong on the volume, because analysts hold volume constant and draw the cost decline as a straight line through time.
Jevons Paradox (writing about coal in 1865) covers the size of the market. A lower price makes uses economic that were not viable at the old price, and those new uses are usually far larger than the old ones, so the market at the bottom of a cost curve is generally orders of magnitude bigger than the market at the top. In compute, each tenfold fall in price brings another layer of white-collar work within reach of automation. The two laws together let us date where a technology sits on its adoption curve and size its ceiling from its cost curve. Both have limits: Wright's Law applies to manufactured, repeatable units, not to commodity inputs or one-off construction, and Jevons fails where demand is inelastic or already saturated.
A learning curve belongs to the industry, not to any one company in it. Everyone on the curve gets the same cost decline, so the manufacturers who achieved it do not keep the surplus; it goes to whoever owns the bottleneck that the growing volume has to pass through. Solar and lithium-ion both showed this. Module and cell makers went bankrupt in waves, while the money went to whichever input was short at the time (polysilicon in 2021 and 2022) and to the inverter and power-electronics layer that every module had to pass through.
The same cost curve is what makes base rates go stale. A base rate describes what happened to a group of companies under a particular set of economics, and a learning curve changes those economics as volume accumulates, so an industry's own history is the wrong reference class while it is on the steep part of its curve. A solar developer in 2010 belonged to the reference class of commodity manufacturers; by 2020 the relevant class was utilities. We therefore choose reference classes by mechanism rather than by sector (industries at the same point on a learning curve, businesses with the same cost structure and the same adoption gate, whatever they sell), we date each class and let older data decay, weighting the last decade over the last five, and where an industry is moving between two mechanisms we hold both classes and shift the weight as capital-cycle and cohort-retention data show which one now applies. If a reference class has not been revisited since the position was opened, it has quietly become the inside view of an earlier period.
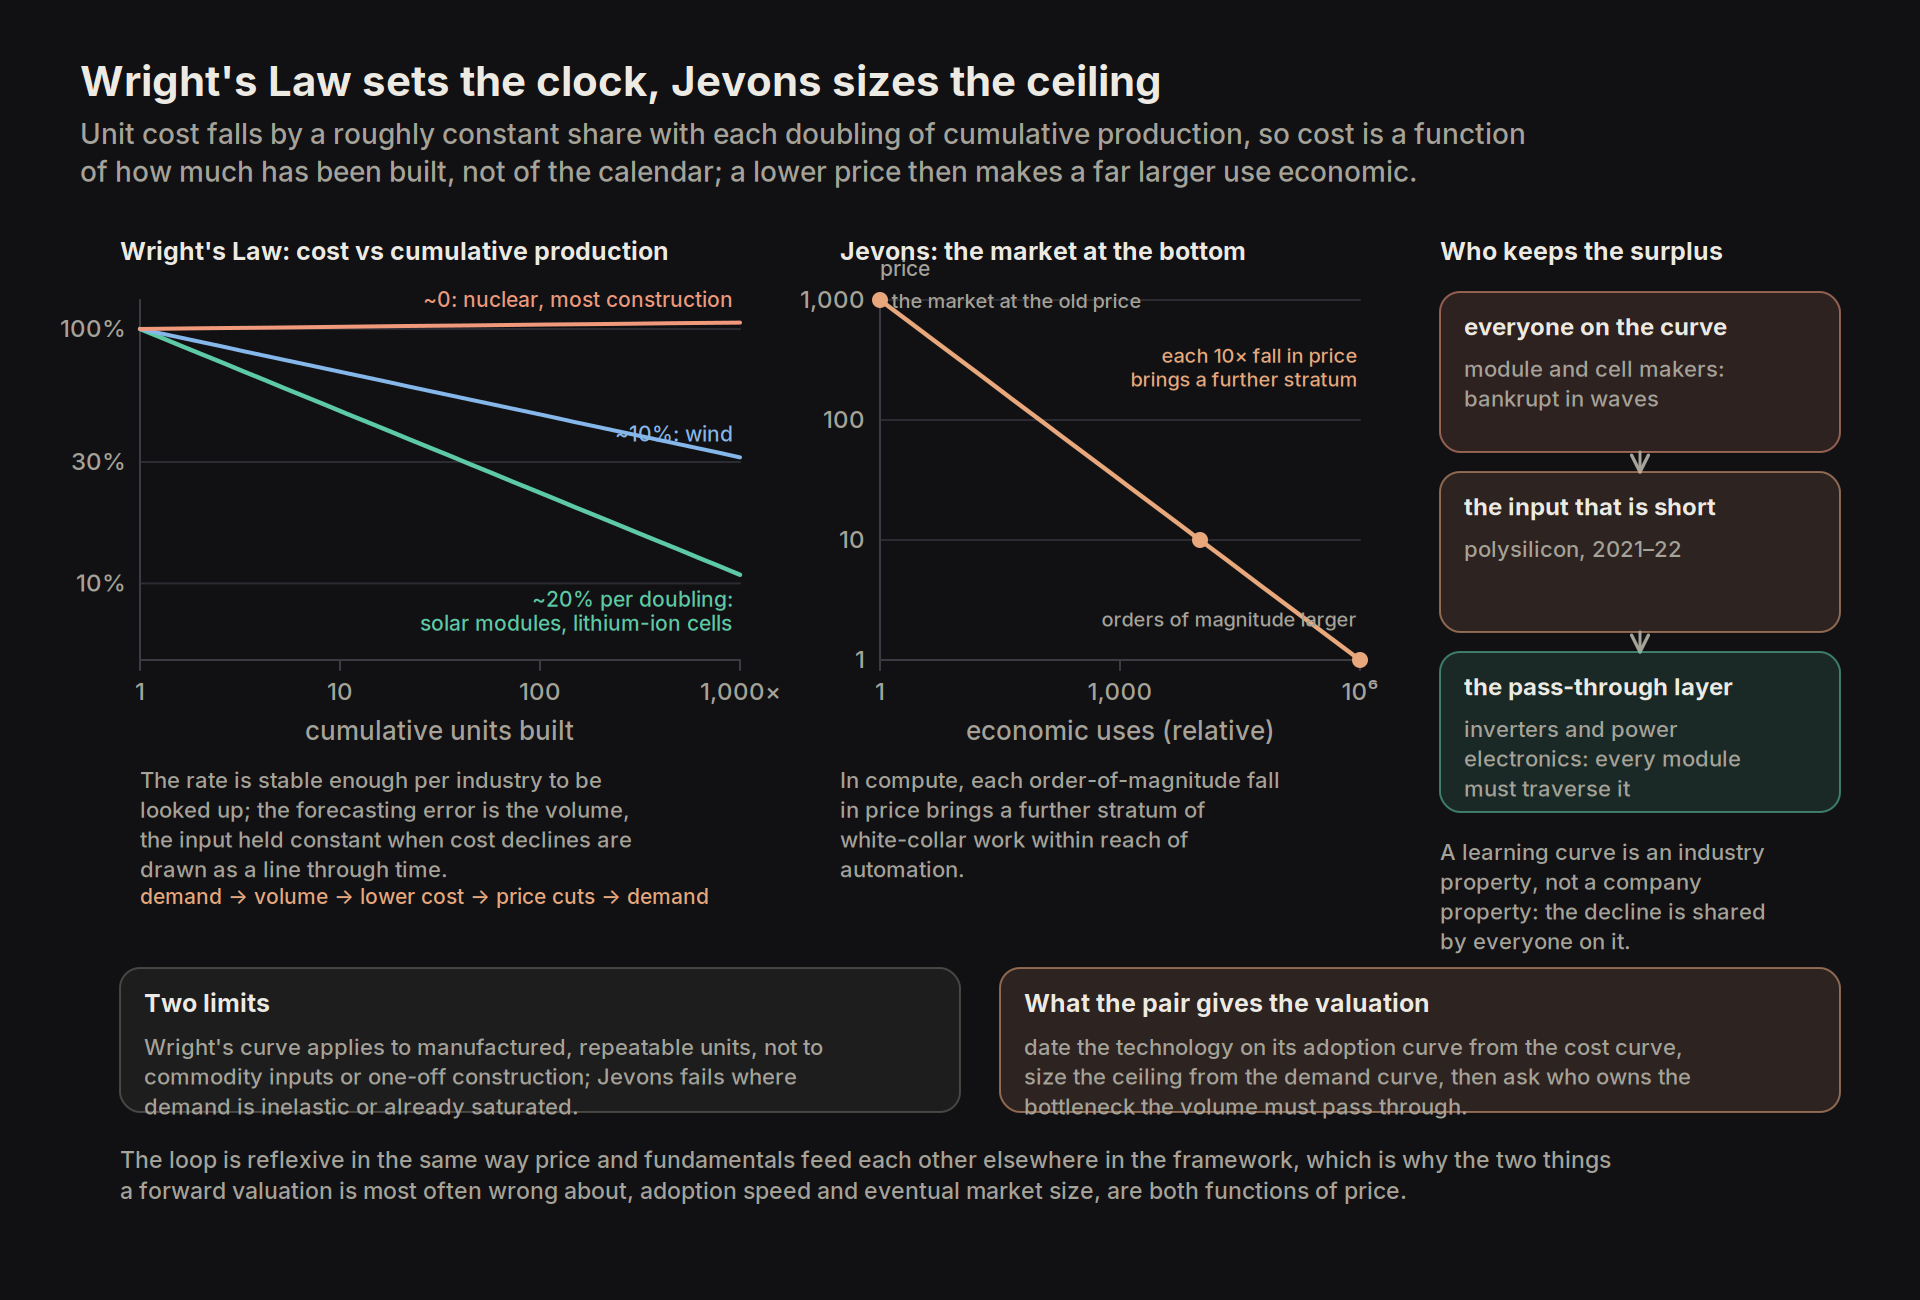
5.4 Capital market surges and deployment cycles
Perez's model ties the previous two sections together over historical time. She observed that technology arrives in surges of roughly fifty years. Each surge has two halves. In the first half, financial capital, which is mobile and does not care which sector it funds, pays for the new infrastructure to be built. In the second half, production capital, which is tied to real businesses, puts that infrastructure to work. Perez counts five surges since 1771: the industrial revolution, steam and railways, steel and electricity, oil and mass production, and information technology from 1971. Each runs through the same phases: irruption, frenzy, a crash and a turning point in which institutions are rebuilt, then synergy and maturity.
The bubble in the first half is useful. The over-investment of the frenzy pays for infrastructure that no single investor would build at a sensible return. The golden age that follows then uses that infrastructure at a fraction of what it cost. The builders rarely get paid for it. They financed the build with capital that the crash wiped out, and the winners of the second half are usually different companies. The railway promoters of 1847 and 1873 and the fibre builders of the late 1990s all lost. The companies that later used the cheap track and the cheap fibre did well.
The live question is which phase we are in now, and it is the most consequential macro call for investors today. There are two readings.
- In the first, artificial intelligence is a sixth surge in its irruption or frenzy phase. If so, the infrastructure build is the useful over-investment, the current capital intensity is appropriate even where individual returns disappoint, and our job is to work out which layer of the eventual stack collects the toll.
- In the second, AI is the late deployment phase of the information technology surge that began in 1971. If so, AI capex is late-cycle over-extension into an installed base that already exists, and we should fade the capital intensity and own the application layer instead.
Perez herself complicates the choice. She argues that the IT surge's golden age was cut short, because the recomposition after 2000 never reined in financial capital and the turning point was smeared across 2000 and 2008. On that view the deployment phase is unfinished. A clean Perez story is exactly the kind of flattering read that has to be tested against the base rate.
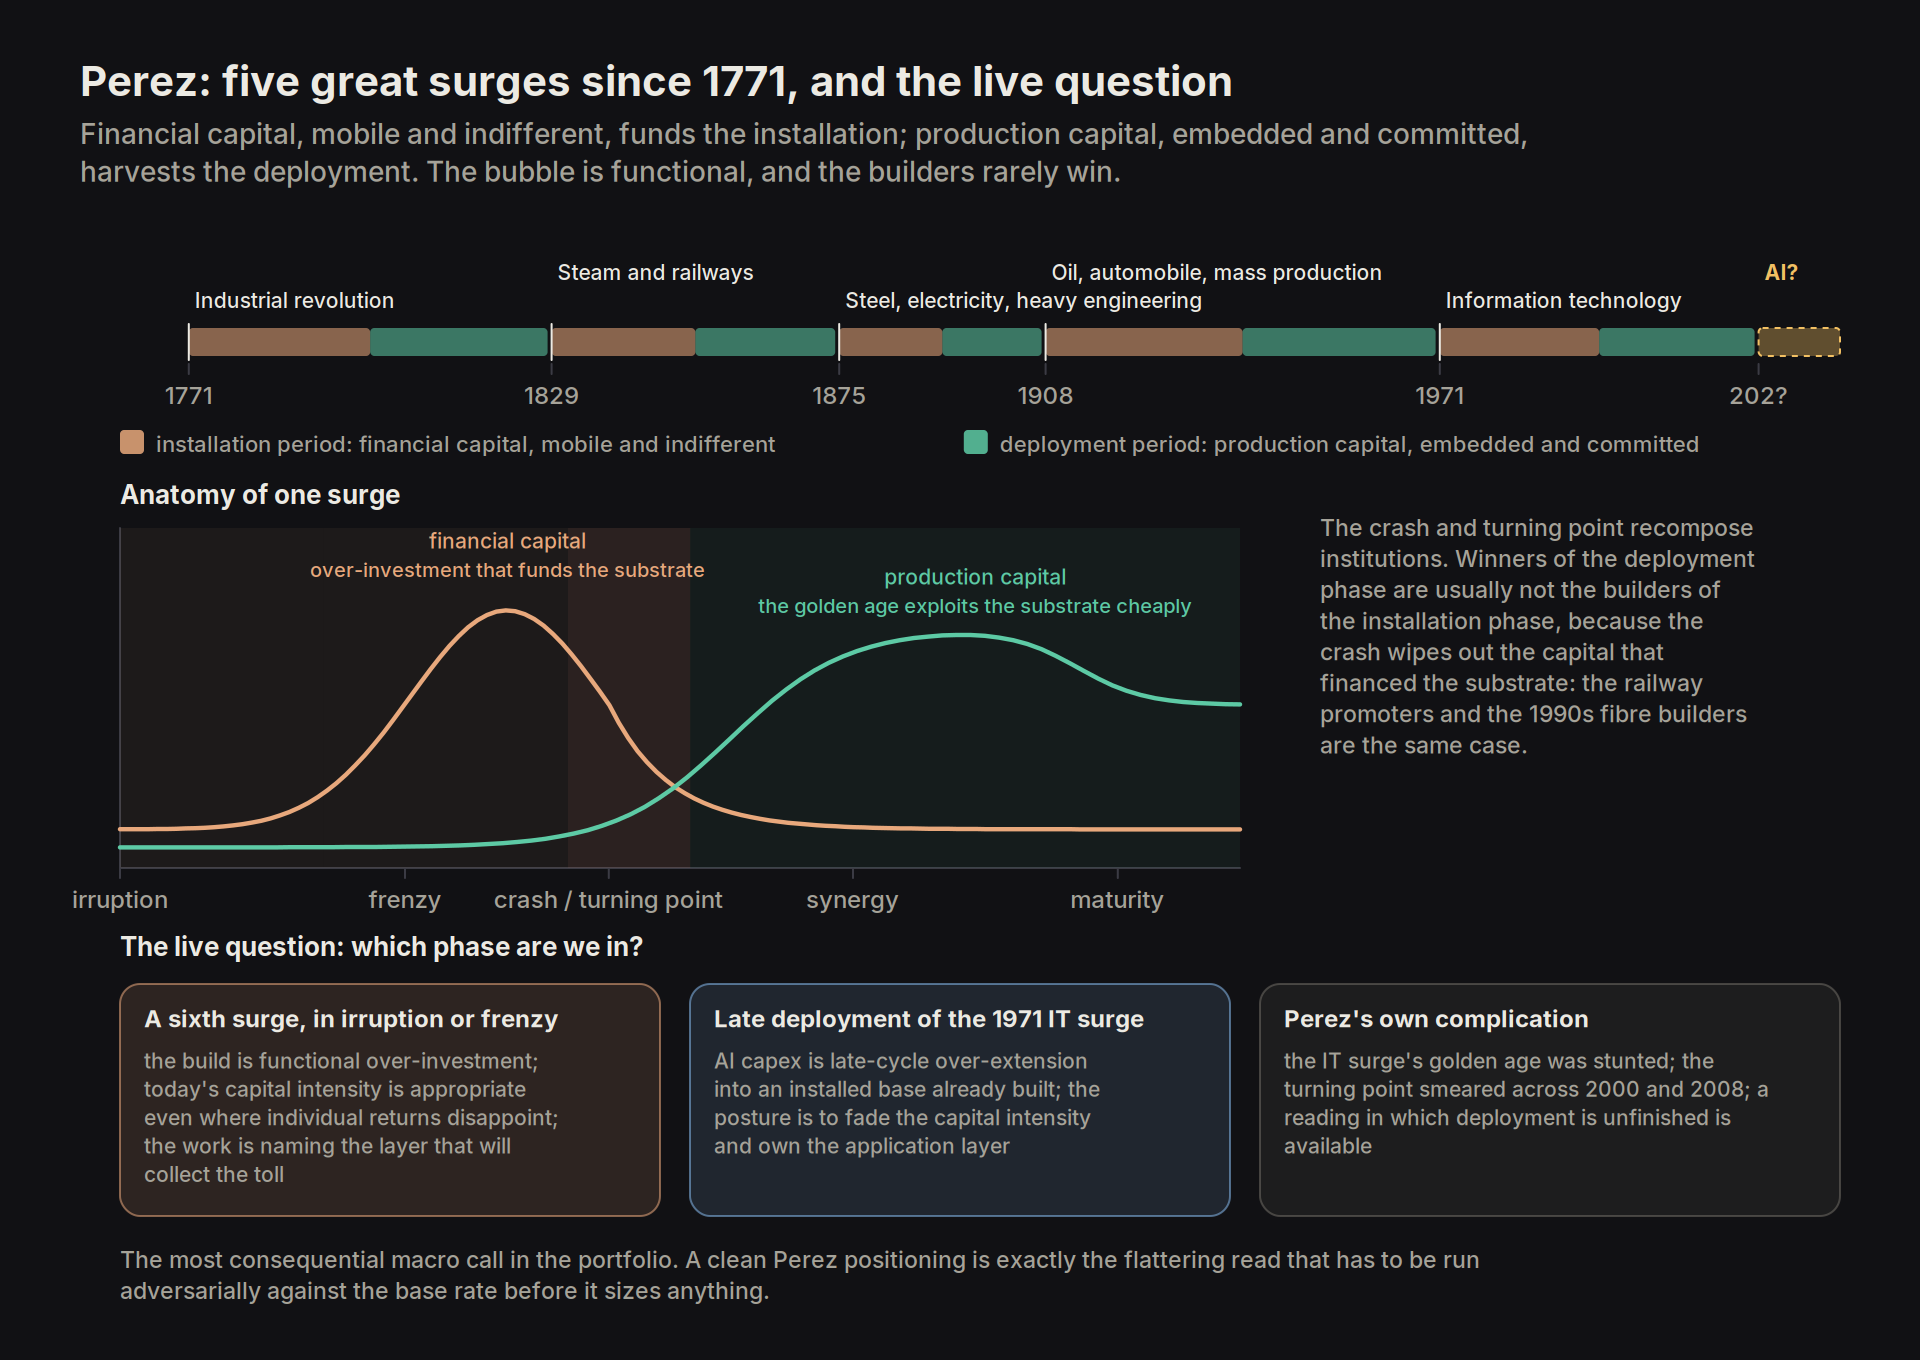
We do not need to make the phase call. We hold it as a probability and act on two things that are true under either reading. The first is where in the stack to be. Builders of the installation phase have lost in every surge so far, because the crash repriced the capital that paid for the build. The layer that charged a toll on the finished infrastructure kept its economics whoever ended up owning it. So we ask one question of every installation-phase holding. Is its pricing power protected by a qualification gate (a barrier to switching suppliers enforced by the customer's own validation process), or by a capacity shortage? A crash does not remove a qualification gate. It removes a capacity shortage within a short period. Only the first survives the phase change. Under the sixth-surge reading we own the toll layer, and the builders are the risk. Under the late-deployment reading we own the application layer that runs on infrastructure someone else paid for, and capital intensity is the risk. The gated toll layer is the only position that works in both. It anchors the resilient half of the barbell. The builders and the application names go in the convex half, sized to what being wrong would cost.
The second is when our temperament is worth the most. The value discipline was built for the turning point. Cash builds while the frenzy inflates. The infrastructure is bought from forced sellers at a fraction of what it cost to build. The position is then held while the recomposition drags on for years. So in a frenzy the instruction is simple: stay solvent and liquid for the day the builders are liquidated, and do not try to guess which builder survives. A book fully invested in installation-phase names at frenzy prices has used up its one advantage before it is needed.
5.5 Creative destruction and the disruption sort
Schumpeter supplies the long-run framework for economic and corporate evolution. Profit from a new idea is temporary. Competitors copy it, and the advantage is competed away. That is the normal state of any industry, so every claim that a moat will last is a claim to be an exception. Christensen supplies the incumbent's response. Customers do not buy products. They hire them to get a job done, and the job lasts far longer than any technology that serves it. Demand is therefore more permanent than supply. The practical rule is to build a thesis around what the customer will still want in ten years, such as lower prices and faster delivery, rather than around the technology of the day.
Disruption scares produce a tradeable sort. When a group of stocks sells off on a disruption story, they all fall to similar multiples, but the outcomes are bimodal. Some are cheap. Some are dying. The average return of the group therefore tells us nothing about any one member of it, and the work is to sort them before valuing them. The trap looks like this. The company screens cheap on tangible assets, but the replacement cost of those assets is falling. Its income statement is missing the investment it would need to stay relevant, so it looks more profitable than it is. Three things separate the survivors. The first is switching costs that lock the product into the customer's workflow. The second is ownership of the system of record, the database the customer treats as the source of truth. The third is control of distribution, the channel through which the customer is reached. Each one buys the incumbent years to absorb the change, and each is visible before the change arrives. Microsoft through the mobile transition had all three. Without them, a cheap incumbent facing live disruption is a melting ice cube. The market often prices it at a reasonable multiple right before the end, and that multiple is not cheapness.
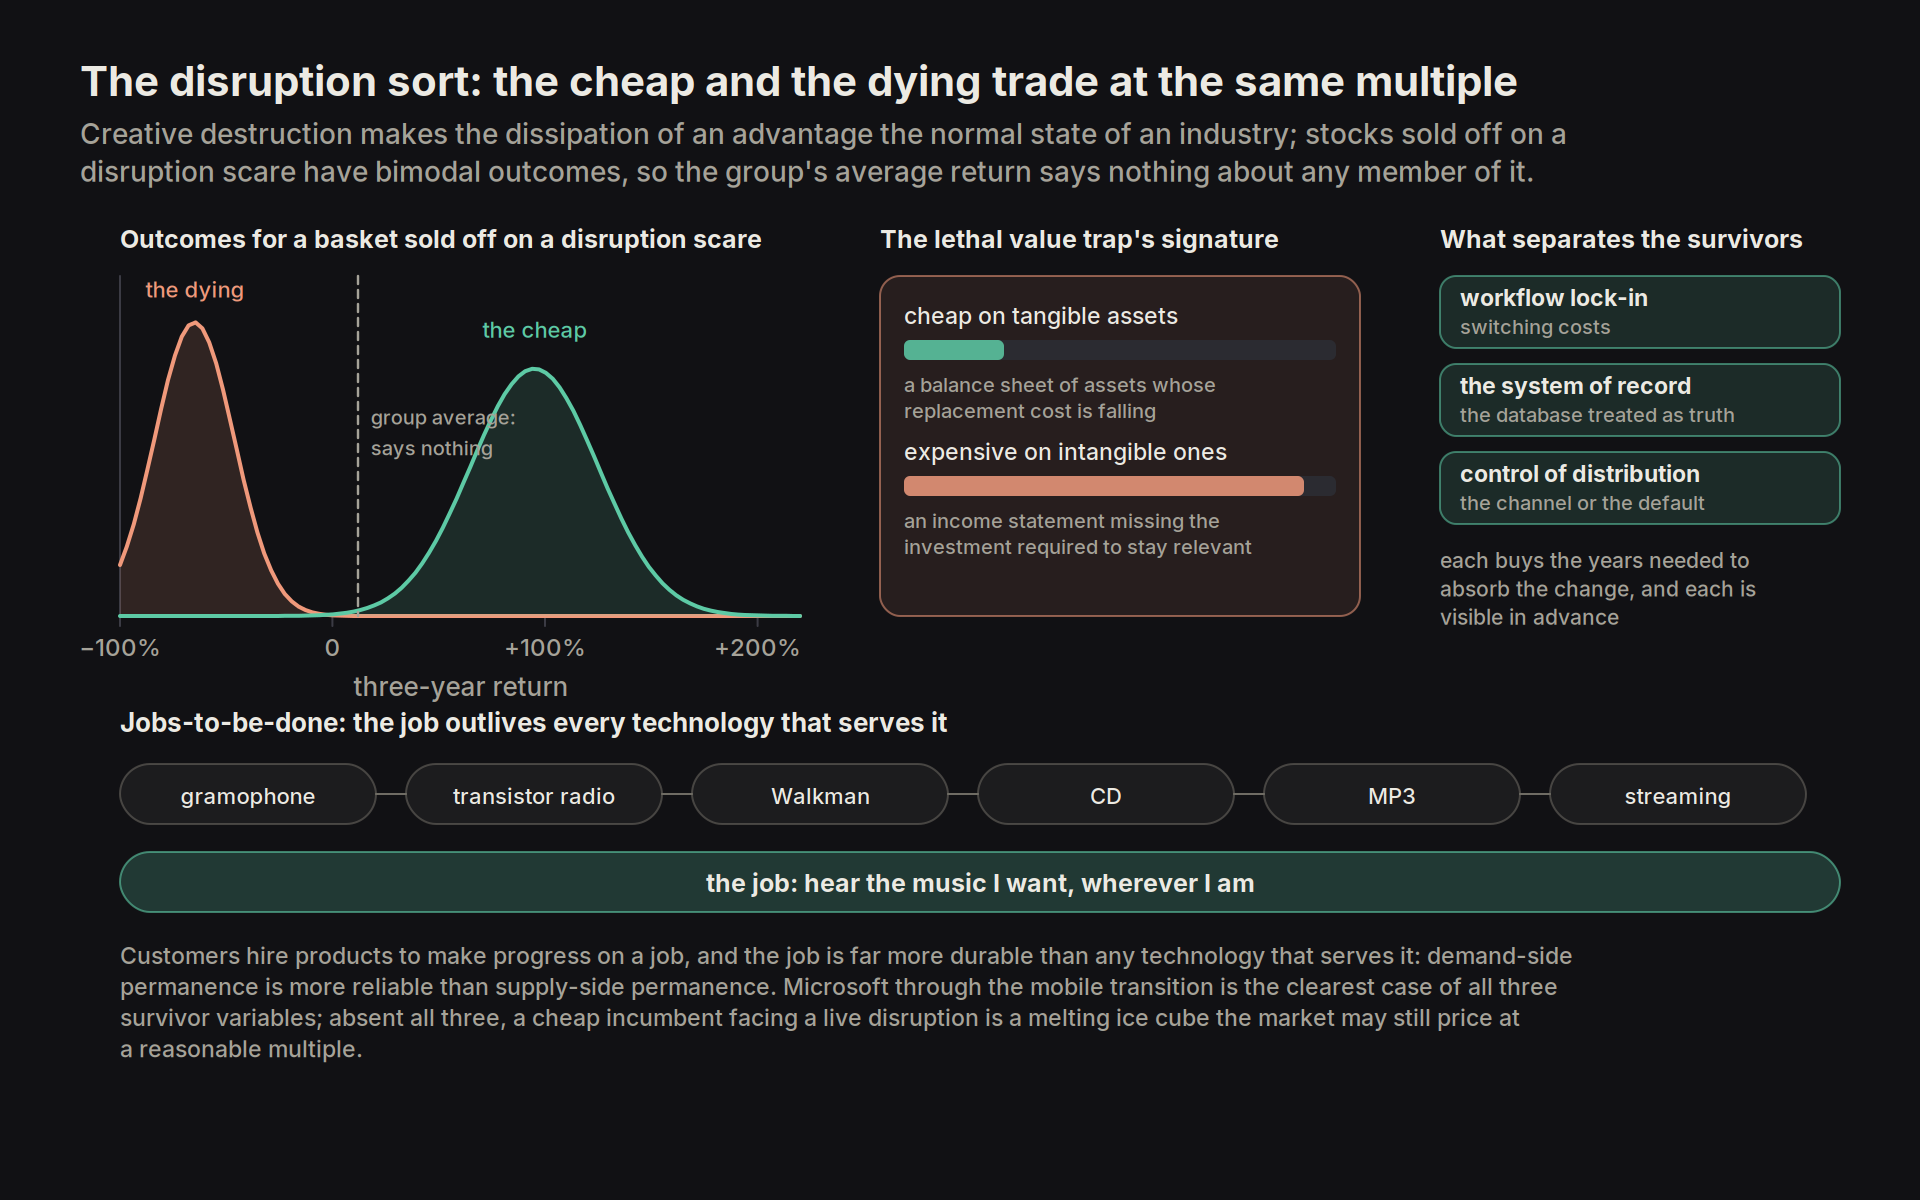
5.6 What traditional accounting fails to measure
The economy is increasingly intangible. Research and development, brand, software and customer-acquisition spend are charged to the profit and loss account in the year they are incurred, despite building assets that last many years. The reported earnings of an asset-light business thus understate its economics, and its book value omits most of what it owns, so price-to-earnings, price-to-book and enterprise-value-to-EBITDA mislead in direction rather than merely in precision, and the return on capital computed from the reported denominator is mismeasured for every business whose real investment is expensed. The repair requires a great degree of judgment: capitalise the investment-like portion of operating expense over a defensible useful life, recompute economic earnings and the invested-capital base, and only then apply the return-on-incremental-capital framework used throughout this essay, since applying it to unadjusted figures produces a number that is confidently wrong. Rebuilding intrinsic value from measured brand, intellectual-property, human-capital and network pillars, shows tangible-only valuation failing inside intangible-heavy sectors while the same value discipline applied to adjusted figures keeps working, and that is the strongest available reading of value's lost decade, the decay of the proxies the factor construction used to stand in for the philosophy rather than the death of the philosophy.
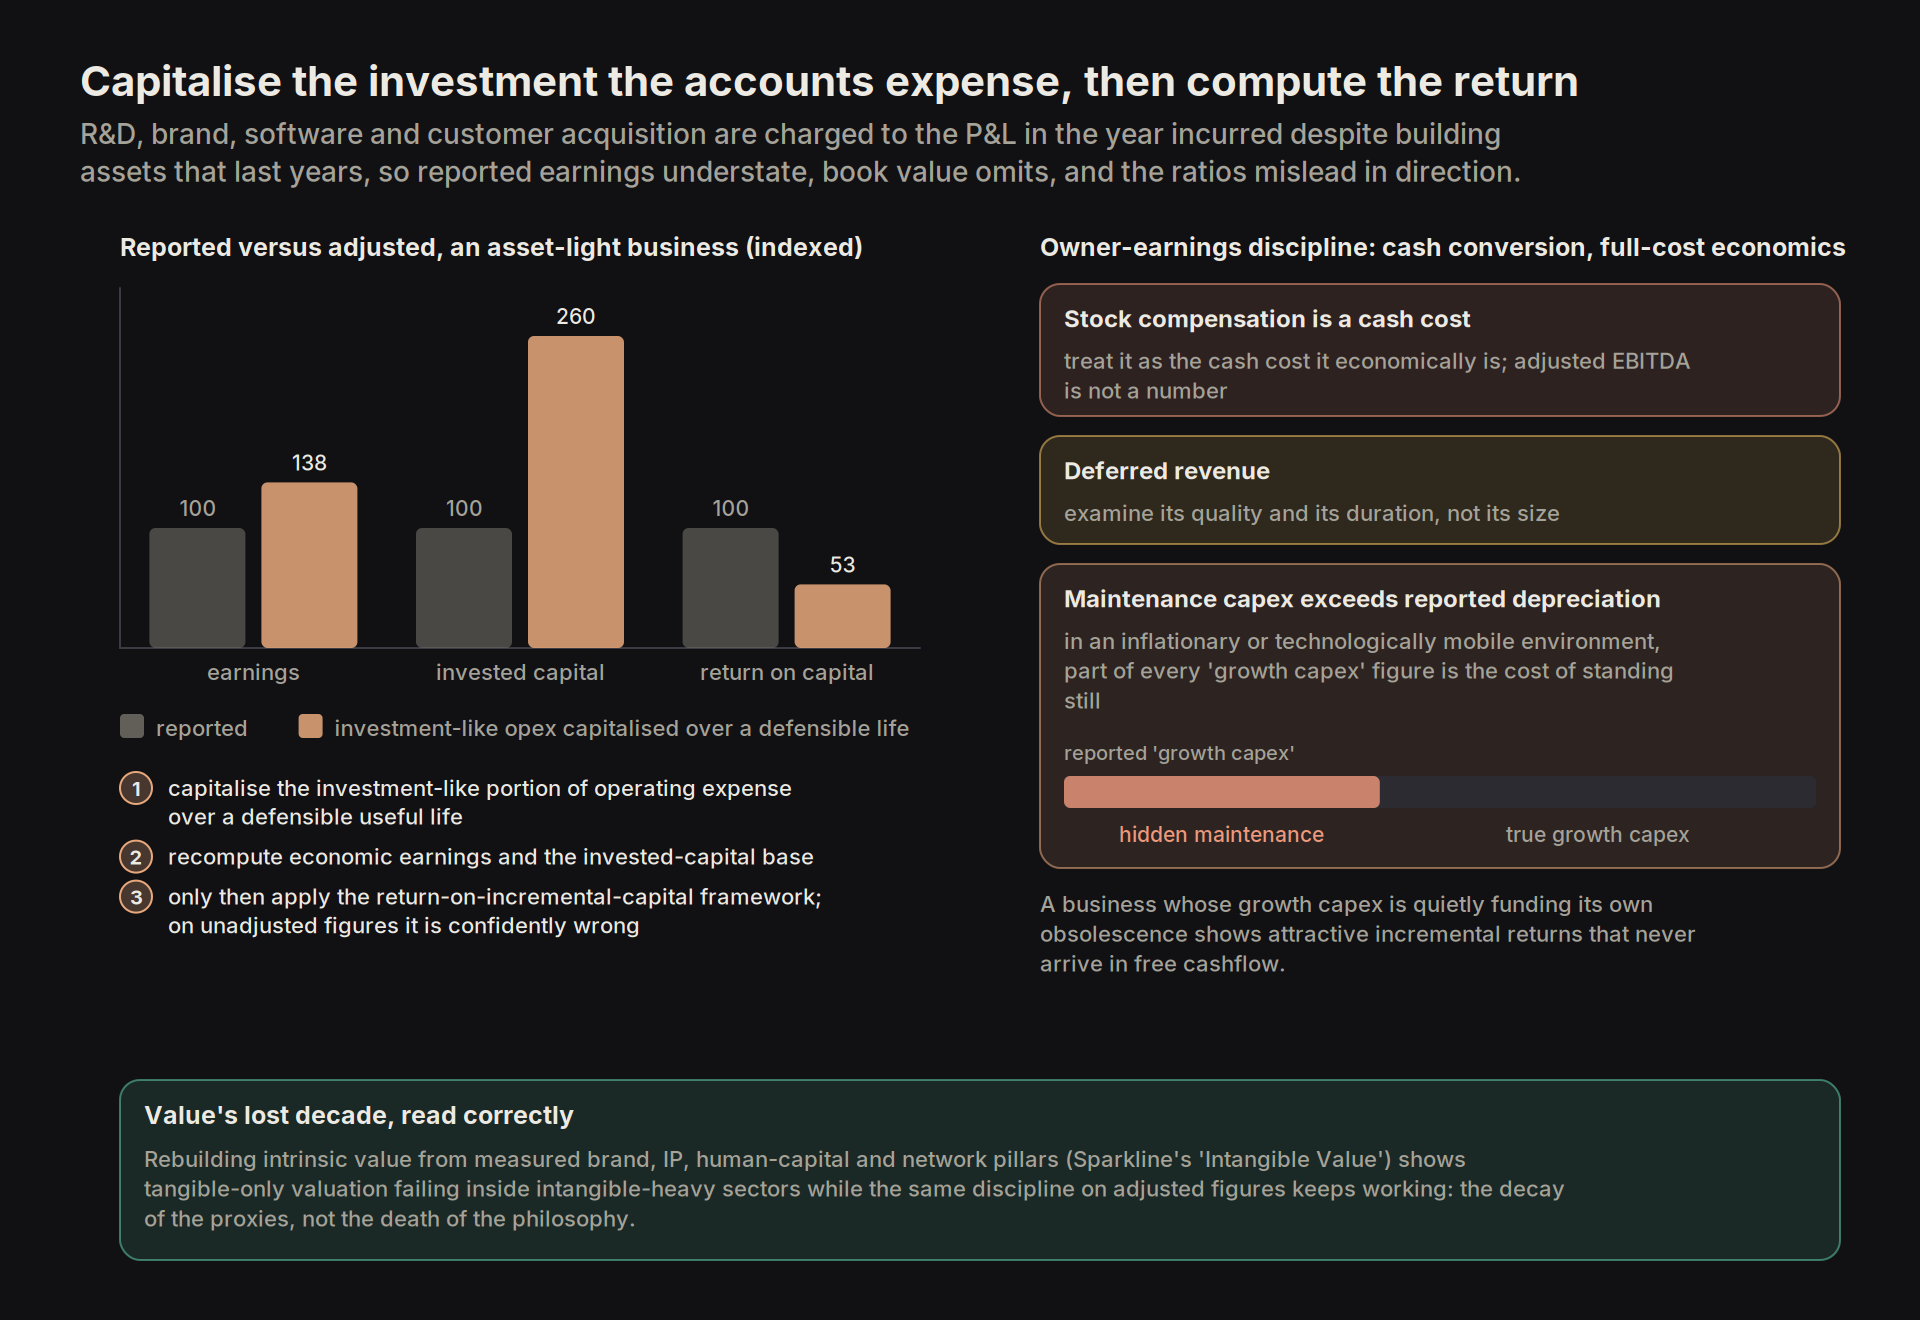
Cohort economics does the next part of the work by decomposing what aggregate growth conceals. A headline growth rate blends customer acquisition and customer retention, which carry opposite implications for value. The components are the number of customers acquired and the cost of acquiring each, the shape of the retention curve, the revenue per retained customer, and the cost to serve, and the retention curve is the most value-determining of the four by a wide margin. The same growth rate on a leaky retention curve is worth a fraction of what it is worth on a flattening one, and the two are indistinguishable in the reported revenue line for several years. This is the customer-unit version of the mining framework, where each retained cohort is an existing mine with a predictable decline rate and acquisition spend is new-mine capital expenditure.
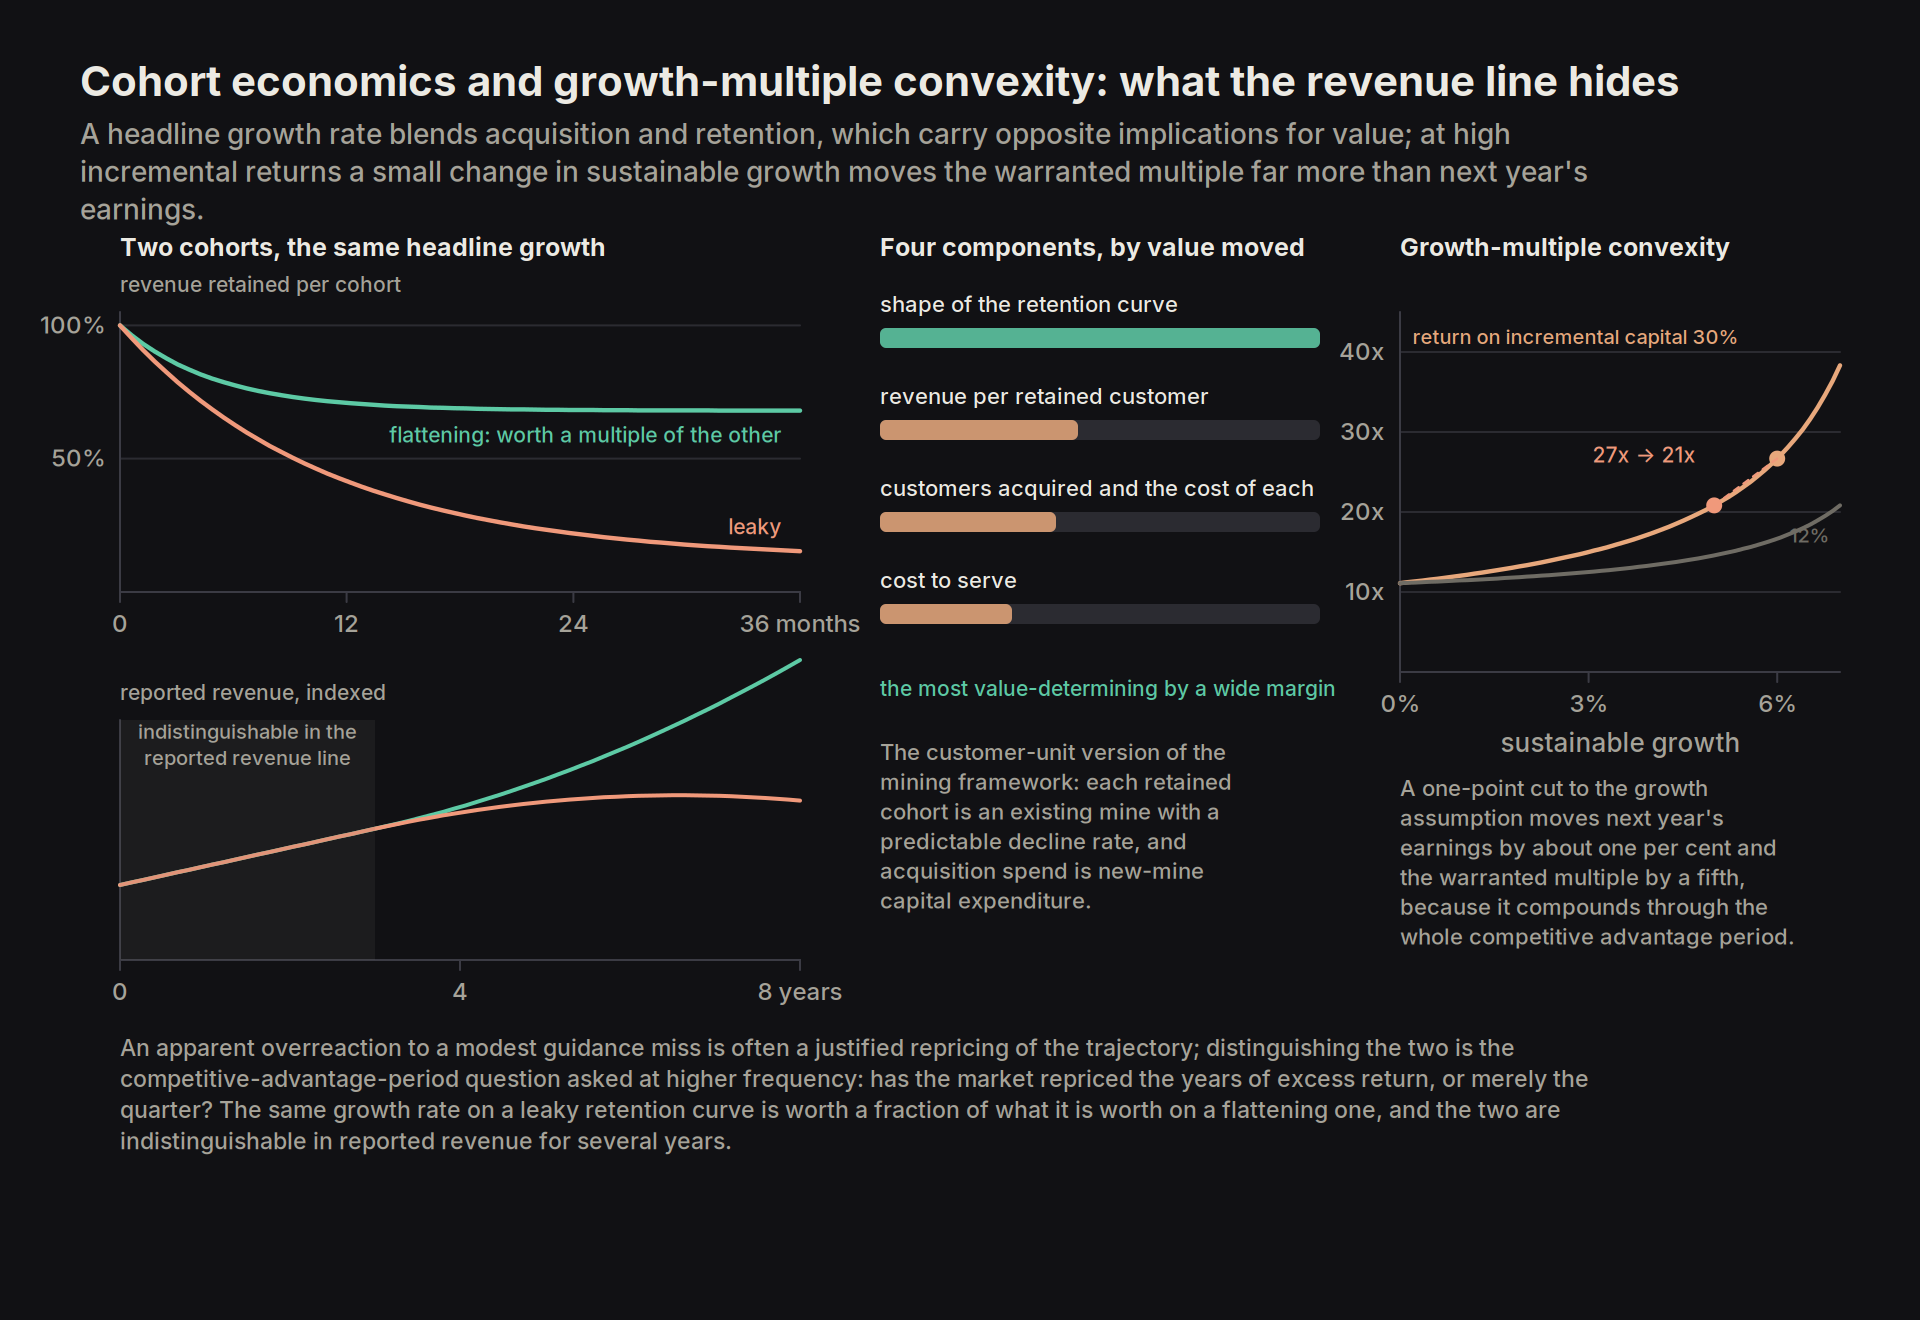
Owner-earnings discipline handles the second adjustment. Judge on cash conversion and full-cost economics, not adjusted EBITDA, which means treating stock compensation as the cash cost it economically is, examining the quality and duration of deferred revenue, and separating maintenance capital expenditure from growth capital expenditure honestly. True maintenance capex generally exceeds reported depreciation in an inflationary or technologically mobile environment, so part of every 'growth capex' figure is in fact the cost of standing still. A business whose growth capex is quietly funding its own obsolescence will show attractive incremental returns that never arrive in free cashflow.
The third adjustment is the treatment of optionality, which carries the largest mispricings. The market typically prices new options at zero and often below zero, on the perception that pursuing them destroys capital, so the value of the existing business plus a pipeline priced at nothing is available to anyone willing to underwrite the conversion. The premium exists only where the organisation can actually convert, which requires the full chain: an industry with high capacity for change to supply the mispriced options, management with the expertise and the time horizon to select the ones worth pursuing, and a workforce adaptable enough to execute them in time. A break anywhere in that chain zeroes the premium, so the industry's capacity for change, management's selection skill and the workforce's ability to execute all have to be graded together.
Finally, growth-multiple convexity explains why the market's reactions to small news are often more rational than they look. At high incremental returns on capital, a small change in the sustainable growth assumption moves the warranted multiple far more than it moves next year's earnings, because the change compounds through a long competitive advantage period instead of landing once. An apparent overreaction to a modest guidance miss is thus often a justified repricing of the trajectory, and distinguishing the two is the same competitive-advantage-period question asked at higher frequency: has the market repriced the years of excess return or merely the quarter?
5.7 Automation and the natural size of the firm
A firm persists wherever coordinating an activity inside it costs less than transacting for the same activity in the market (Coase), and the two curves that cross to set its natural size each have a source that can be named. Economies of scale come from the production side: a fixed cost, whether a fab, an R&D programme, a codebase or a sales channel, spread across more units until the marginal unit carries almost none of it, purchasing power over suppliers, the learning curve, and a division of labour fine enough that each employee does one thing well. Diseconomies come from the coordination side, and they are internal and therefore visible in advance: the work of keeping the firm organised rises faster than the headcount that does the producing, since every additional employee has to know what the others are doing and be told when it changes, and past a few hundred people that knowledge can no longer travel by conversation, so the corporation installs rules, processes and middle management to stay organised, each layer of which produces no output of its own, consumes a share of every hour worked beneath it, and adds a hop between the ground truth and whoever decides on it, which is the same accumulation of 'deadweight'. The natural size of the firm thus sits where the marginal saving from one more unit of scale equals the marginal cost of the coordination needed to capture it, and any technology that moves either curve resizes every firm in the economy at once.
Information technology moved both curves in the same decade, since markets became cheaper to transact in at exactly the moment large organisations became cheaper to run on shared software, and for the better part of twenty years it was genuinely unclear which effect was winning; it is not unclear any more, because the coordination curve is the one that has bent. Software gives coordination increasing returns, since what everyone else is doing is written once into a system of record and read by everyone beneath it instead of being carried by a layer of managers; automation lifts revenue per employee on flat or falling headcount, so there are fewer people to coordinate per unit of output; and cheap intelligence lowers the cost of coordinating a large organisation faster than it lowers the cost of transacting in a market, because a model pointed at a written record of decisions answers the question a middle manager used to exist to answer. The equilibrium has thus tilted toward larger winners, the natural size of a layer monopolist has grown, the headcount at which a matrix organisation has to ossify into rules and hierarchy has risen with it, and the old base rate for diseconomies of scale binds far more weakly than it did. This is also why comparable-company analysis lost its footing as the field of genuine peers thinned out, and why the surplus from an industry-wide learning curve ends up with whoever owns the bottleneck the volume has to pass through. Value thus concentrates within narrow functional layers and generally not across diversified firms, and the structure that wins is a focused near-monopoly over one layer that everything above it must pay to traverse, TSMC at the leading edge being the cleanest case; cheap intelligence then sets the sign of that overlay in both directions at once, hardening the bottom of the stack (compute, fabrication, the system of record, the distribution default) while loosening the top, because any competent team can now rebuild the application layer in a quarter. We therefore grade every candidate on whether it collects the toll or sits in the exposed position above it, and a company paying rent to a layer it does not own is a renter however good its product.
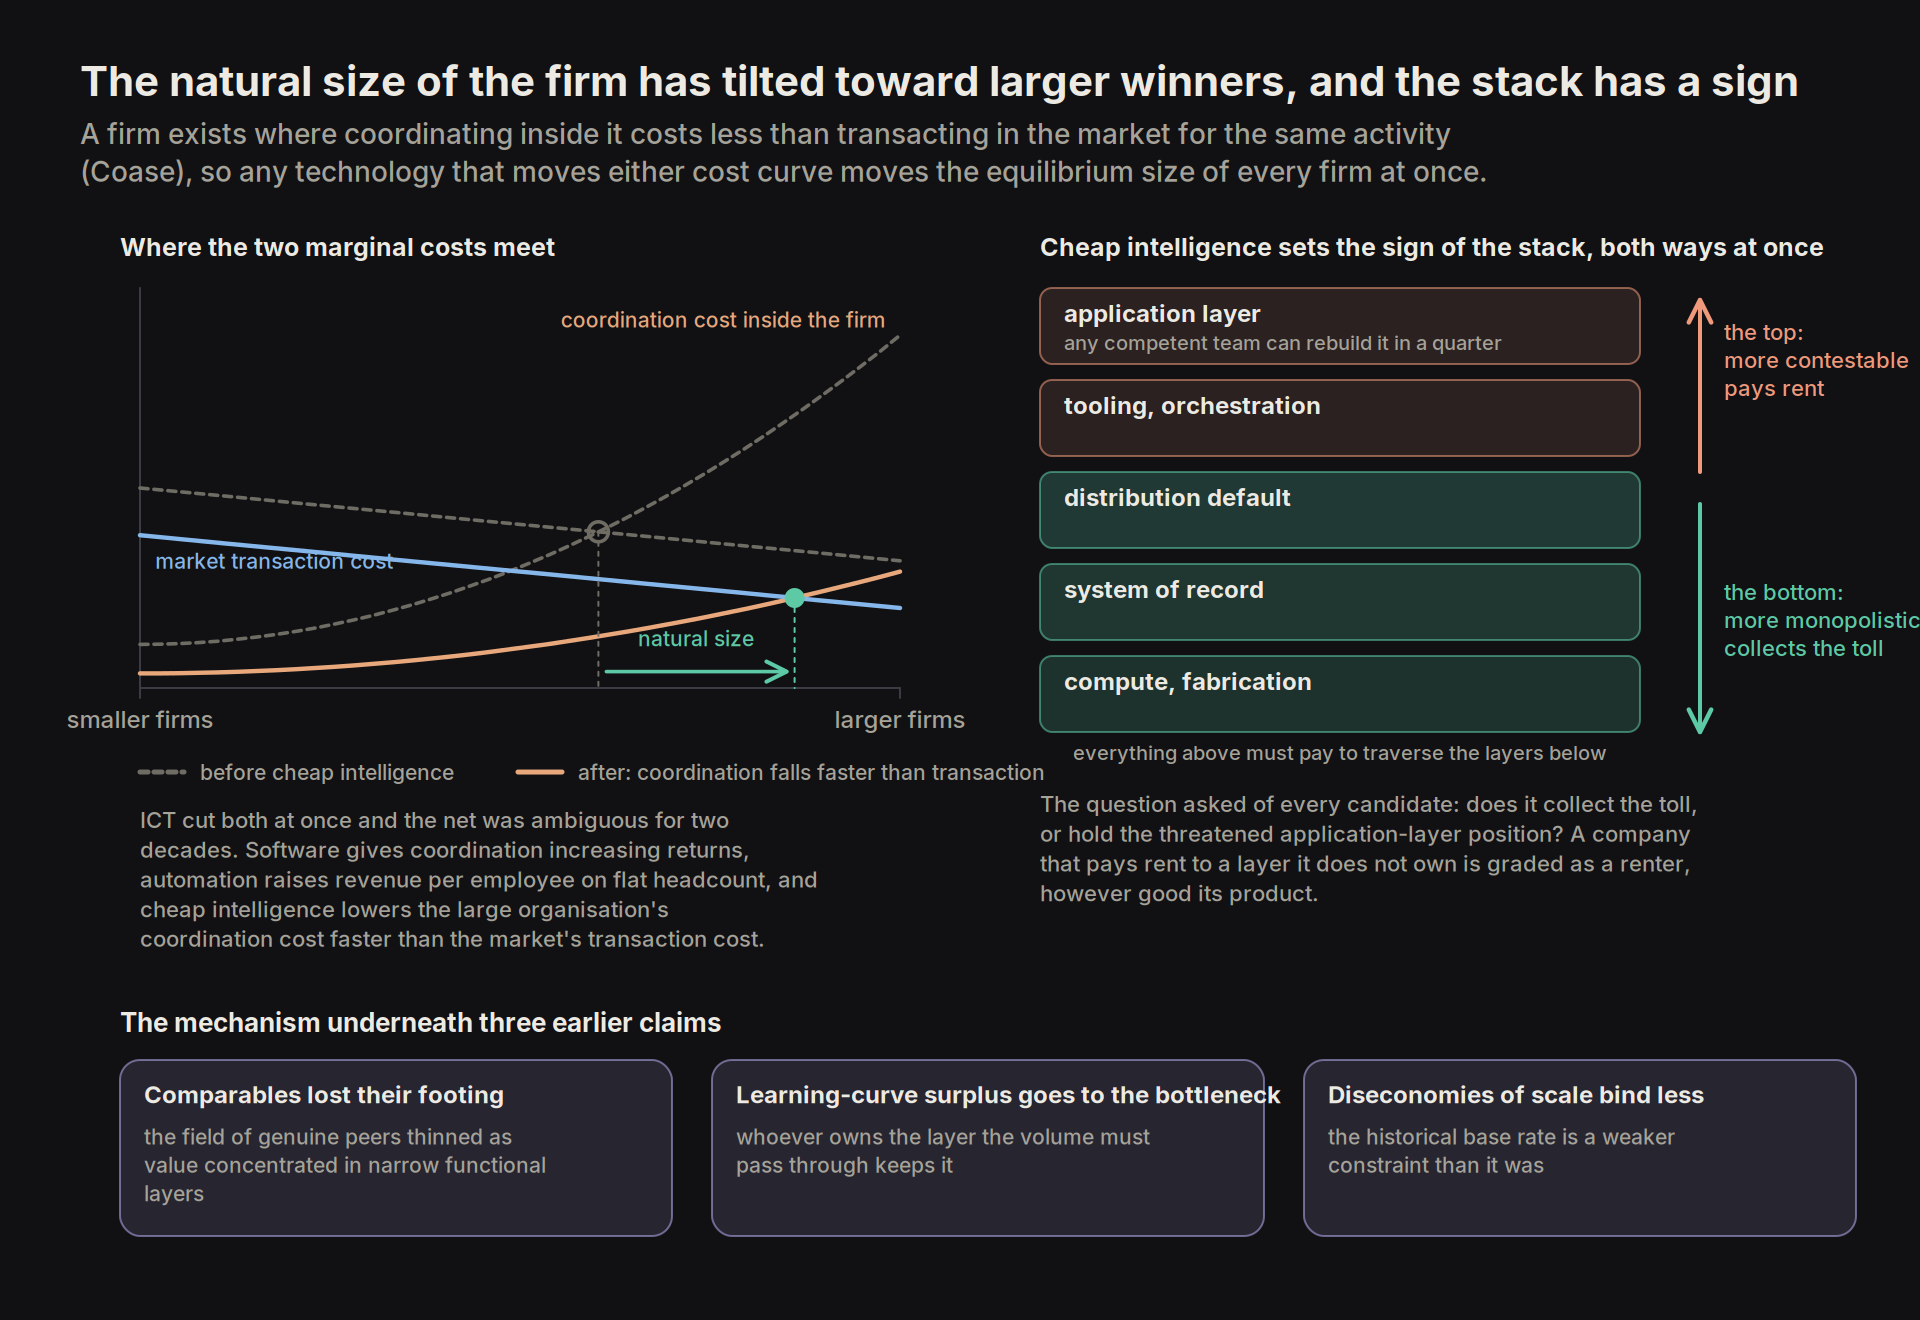
We grade a company's readiness to absorb this change on how it actually operates, meaning the duration of its incentives, how many hops a piece of information takes before it reaches someone who can act on it, and how far the workforce is aligned with the mission, and not on its stated AI strategy, since narration is free and the absence of a number is itself the datapoint. What we look for is a documentation-first, asynchronous culture in which decision rights are codified and the 'why' behind a decision gets written down somewhere a machine can later reach, a governed data estate, revenue per employee rising on flat headcount, and management commentary that puts a number on what has been automated and what it cost; what we mark down is 'context theatre', where every interaction is logged and none of it feeds back into anything, dependence on tribal knowledge, a physical or regulated core that resists digitisation, and 'wrapper risk', the position of a company whose product is a thin layer over a frontier model that the model's owner can absorb whenever it chooses. The whole overlay breaks if context windows become reliably large and cheap enough that the premium on curated context compresses to nothing, though even then the organisational leg survives, because someone still had to write the reasoning down, and no context window manufactures a decision that was never recorded.
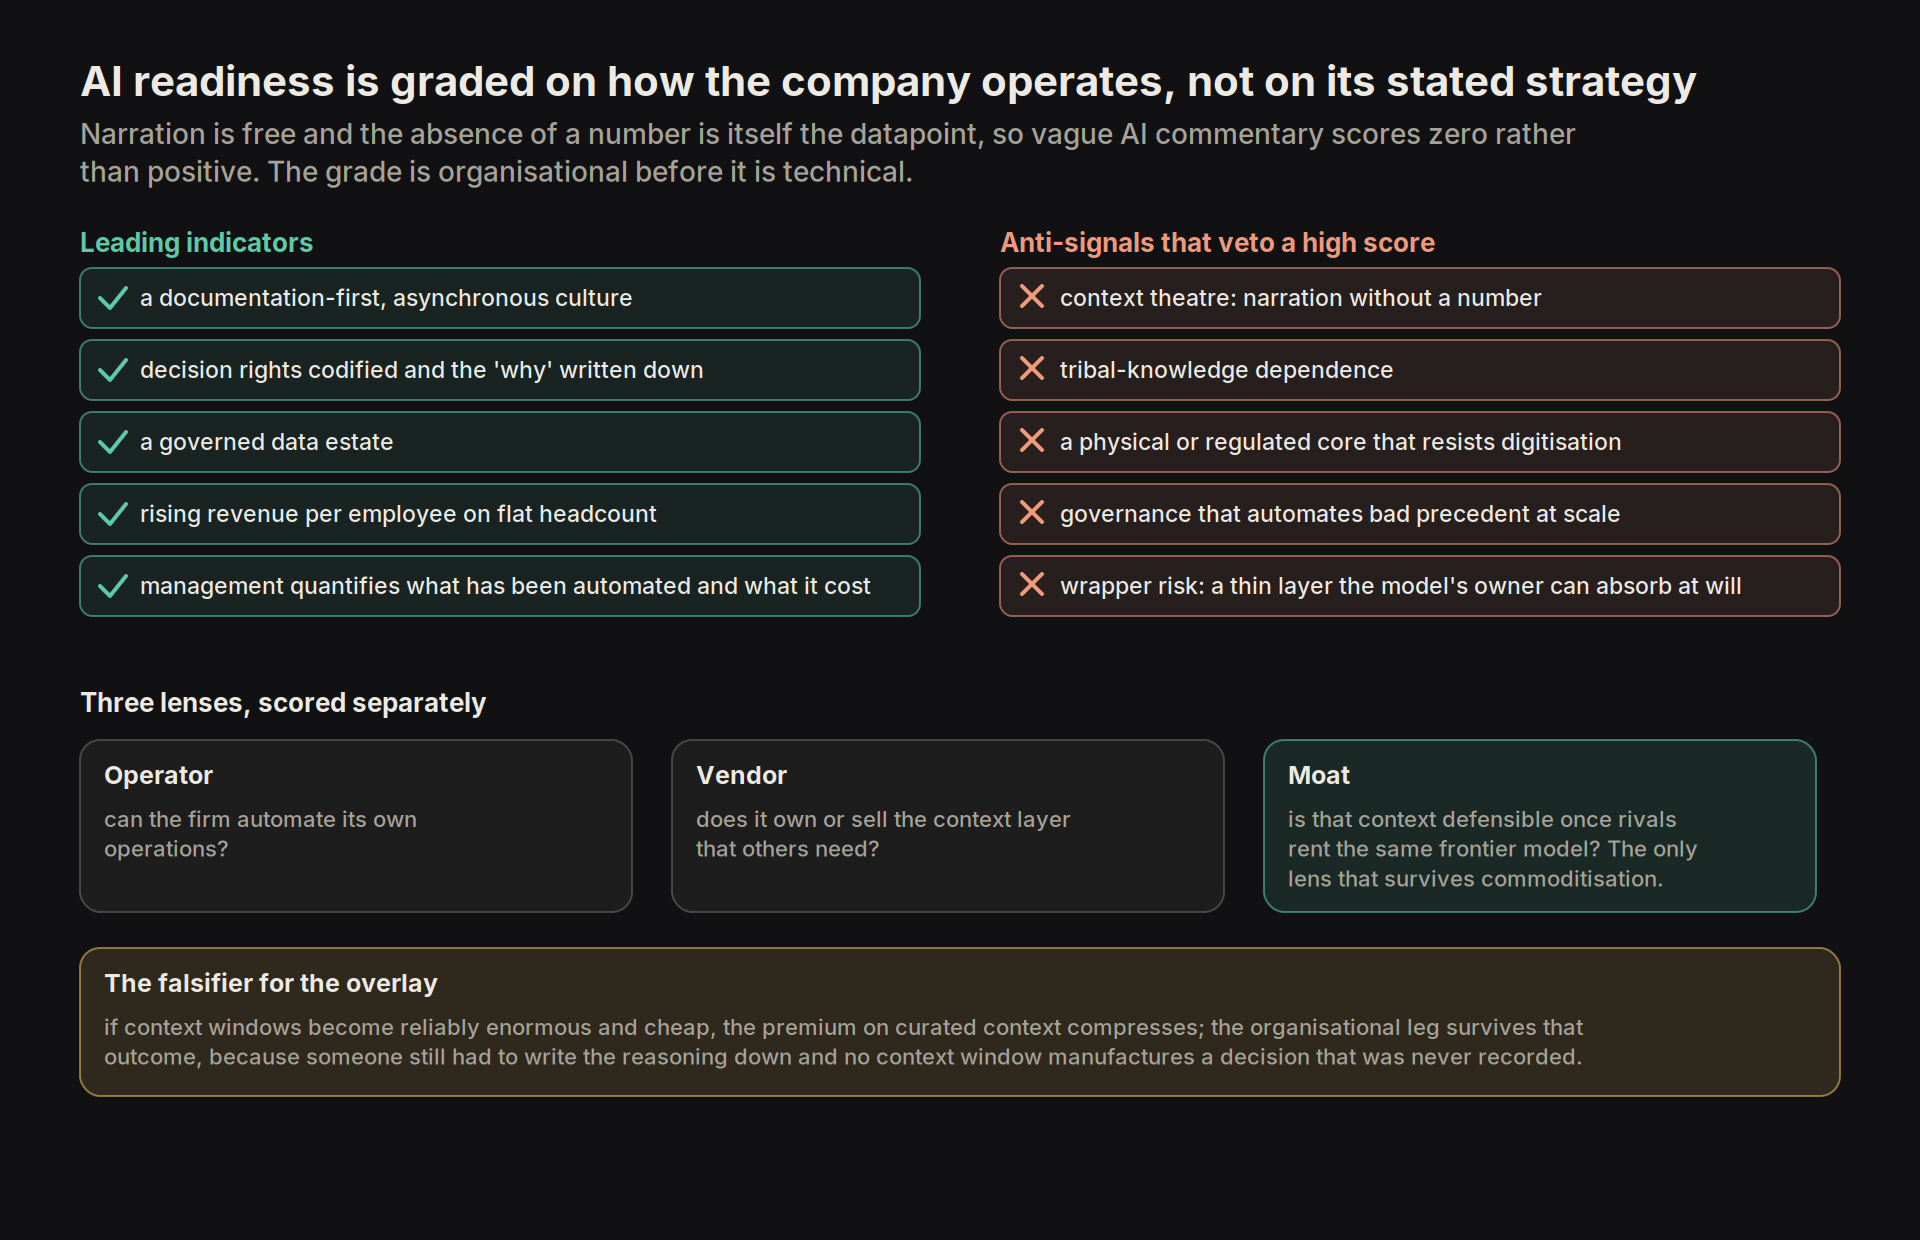
5.8 AI in investing
The marginal unit of analysis now costs roughly nothing (a DCF, a comparable set, a transcript summary and a first-draft industry map are all produced in minutes by a model that has read every filing) and models are spreading through every investing workflow at once, so the edge that came from processing the same information better has been compressed harder than disclosure rules ever compressed the edge that came from simply knowing something others did not. What spreads with the models is speed rather than judgement, and in this industry speed runs one way, since a decision that can be reached in an afternoon gets made in an afternoon, so the collapse in holding periods continues and the one-to-six-month window that was already the most competitive stretch of the curve grows more crowded still, while the behavioural biases catalogued investors have are amplified rather than corrected, because a model is a coherence engine that will build a persuasive narrative around whatever the investor already believes and will supply social proof on demand, every participant's model having read the same corpus and returning the same consensus. The temporal and psychological edge thus widens for whoever declines to spend it, and the patient investor who uses the model as an education tool over the long term, to repair the gaps in his understanding of the industries he does not yet own, while resisting the considerable allure of using it as a decision-making tool in the short term, is likely to generate greater returns than the one who lets it shorten his horizon.
Run that way the model is a 'second brain', pointed at a context that holds our current level of knowledge of each industry, the maps, the dated forecasts and the written falsifiers, together with the record of every decision made and why, and that context is what lets it hold us to objectivity and rationality while the price moves against the position, because a model can be effectively 'trained' through the context files to think as we think; the same files carry every one of our biases into it unedited, which is the cost of the arrangement and the reason the context is dated and the falsifiers are written before entry. Embedding LLMs into the workflow has thus become 'table stakes', the context that has evolved with the investor over years and that no off-the-shelf model can replicate is where the edge now sits, and we think a model amplifies good-quality thinking and, for most participants, will be detrimental to returns wherever it is used as a replacement for it.
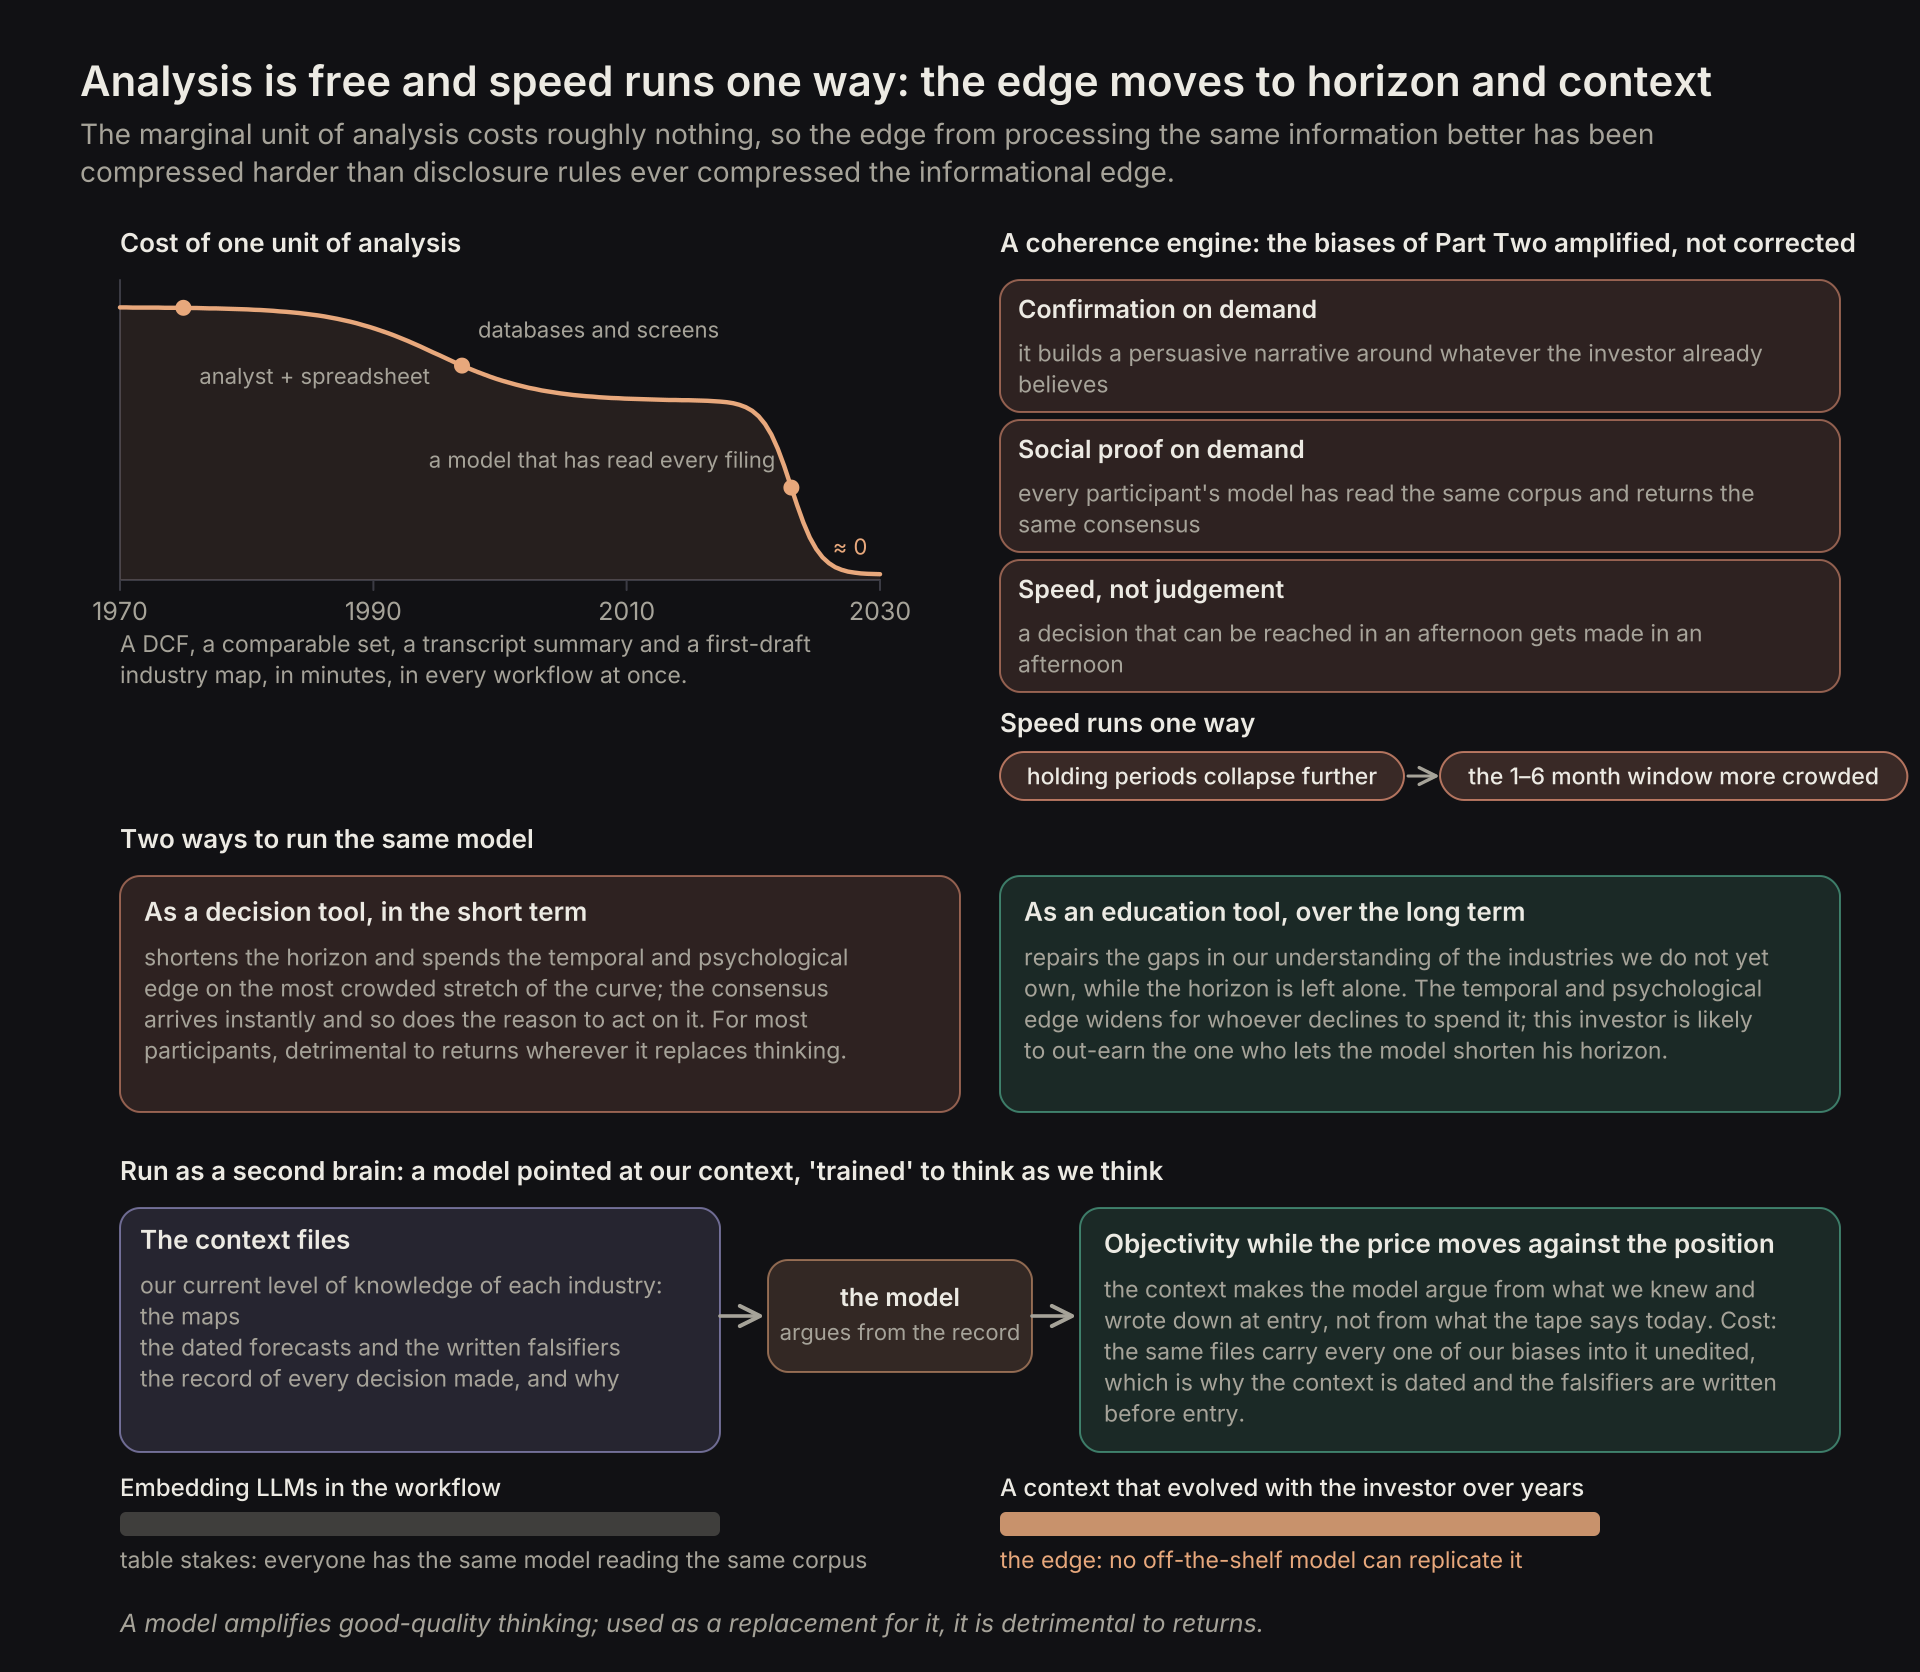
5.9 Companies deploying novel technologies are usually undervalued
Price is set at the margin by whoever is willing to transact, and in a business whose profit pool is compounding the marginal participant is almost always a buyer, since the holders who have done the work are not selling at the current price and are in most cases already 'tapped out', sized to the limit that their mandate, their liquidity rule or their own concentration discipline allows. For the market capitalisation to track the growth in intrinsic value, incremental capital therefore has to arrive from outside the existing holder base at roughly the rate at which the profit pool is growing, and where that capital does not arrive the stock embeds an automatic discount.
That incremental buyer has to have done the work, and where the business performs a genuinely new function, in a market gated by physics, engineering or a specialised technical discipline, the work is a multi-month industry map rather than a weekend with the filings, so the pool of capital able to buy is bounded by the pool of people who understand the business, which we term the 'comprehension gate'. The gate binds hardest on the participants with the most capital. A large allocator cannot economically spend analyst-months on a name it cannot deploy into at size, its mandate generally requires index membership, liquidity and a market-capitalisation threshold that the novel name has not yet crossed, its sell-side coverage is set by commission and banking economics that a small and technically opaque company does not generate, and its career-risk structure punishes an unfamiliar position that fails far more than it rewards one that works. The people who do the incremental research on novel ideas are as such astute retail investors, practising engineers with a brokerage account and small funds, and they hold little capital relative to the profit pool they have correctly understood; the comprehension exists in the market, but the capital attached to it does not.
Assuming existing investors have tapped out their mandates, and holding all else equal, an opportunity with a doubling profit pool annually, the number of participants who 'get it' has to double each year merely for the name to remain at the same market multiple, and the true requirement is higher, since not everyone who understands the business buys it, not everyone who buys it can accumulate, and a share of last year's informed holders will have reached their own sizing limits. Comprehension diffuses on a social clock, through conference talks, technical writing, a first sell-side initiation and word of mouth among practitioners, and that clock runs far slower than a doubling of profits, so the discount compounds for as long as the growth does. Any novel technology that finds explosive growth in a sufficiently technically gated market is thus structurally undervalued. We believe that these type of opportunities present an evergreen hunting ground in the environment of hyperchange.